Yesterday’s Weak CPI Report Triggered the Biggest Day of the Year for Bulls

Yesterday’s Weak CPI Report Triggered the Biggest Day of the Year for Bulls
By:Tim Knight
Here’s a look at how some exchange-traded funds fared
The rally following yesterday’s weak consumer price index (CPI) report was one of the biggest events of 2023 for equity bulls. The Dow rose almost 500 points, the S&P climbed almost 100 points and the Russell 2000 surged an eye-popping 5.44%. Below are eight exchange-traded funds (ETFs) in particular interesting setups following this mega-rally.
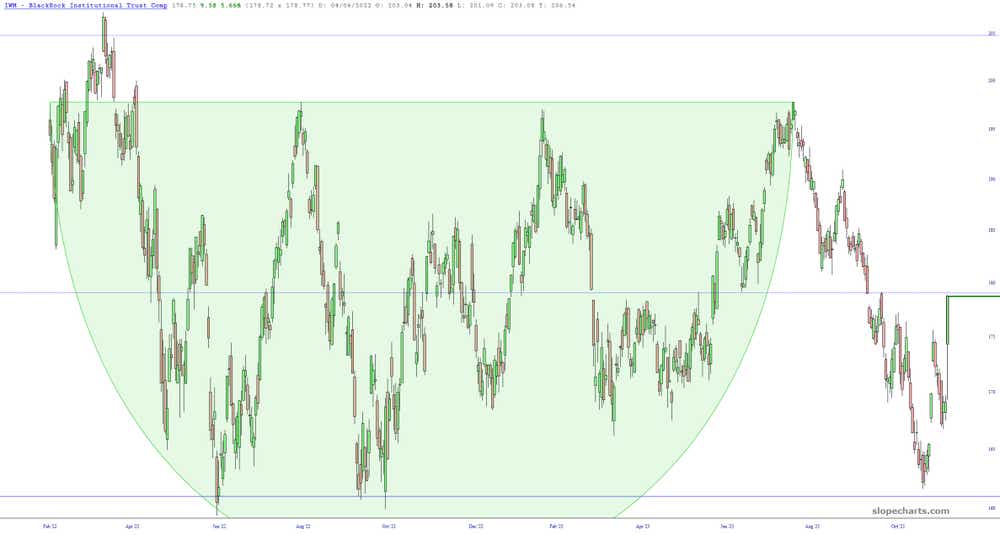
We start with the small caps, which have been range-bound for years. The Fibonaccis—a series of numbers in which each is the sum of the two preceding numbers—have had an extremely powerful influence, acting as either support or resistance in just the past couple of weeks. The iShares Russell 2000 ETF has rallied from one Fib (as support) to another (as resistance). The price is just about at the midpoint, which should provide a meaningful barrier to further price ascent without some important new catalyst to propel it over the midline.
IWM
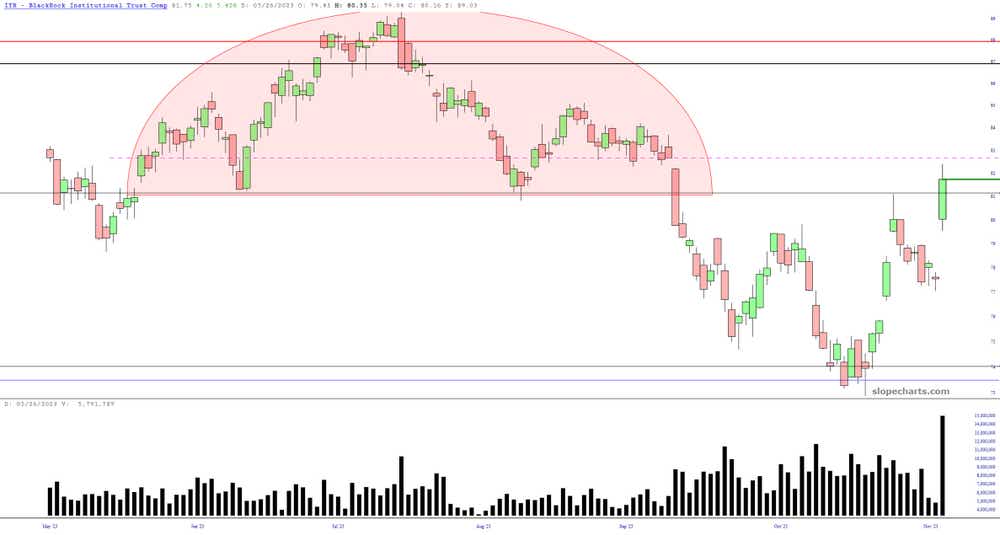
The real estate fund has pushed into the pink zone defining the head and shoulders top, damaging the credibility of that pattern. The real test will come in the form of the price gap, which it has neither sealed nor exceeded. This is the one chart, incidentally, in which volume is also shown, because the extraordinary increase in volume yesterday (the highest in many, many months) is worth including.
IYR
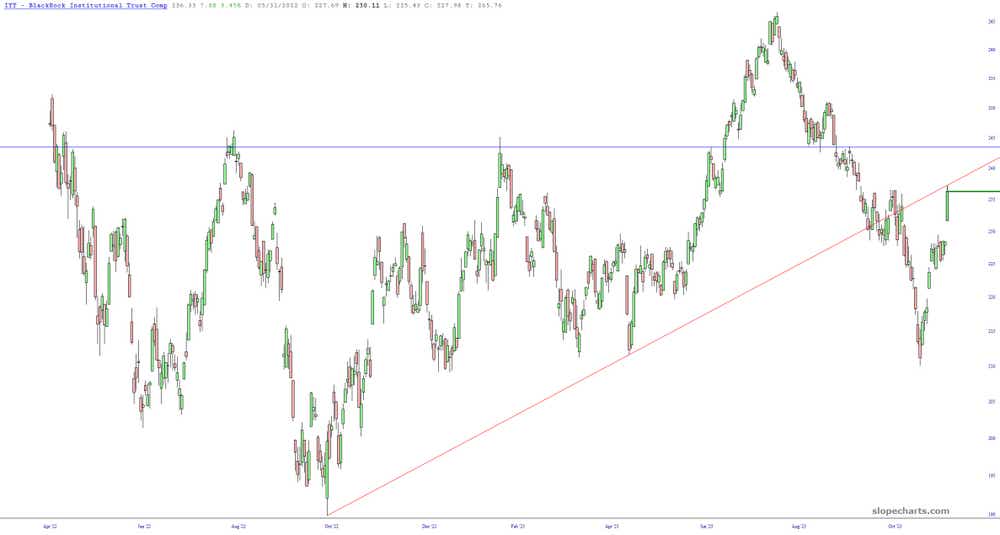
One of the cleanest trendline-based setups is in the form of the Dow Transports, which is sporting a pitch-perfect tag of its broken trendline. That means the price has approached the line in its role as resistance instead of its former role as support. It is unlikely to go much higher.
IYT
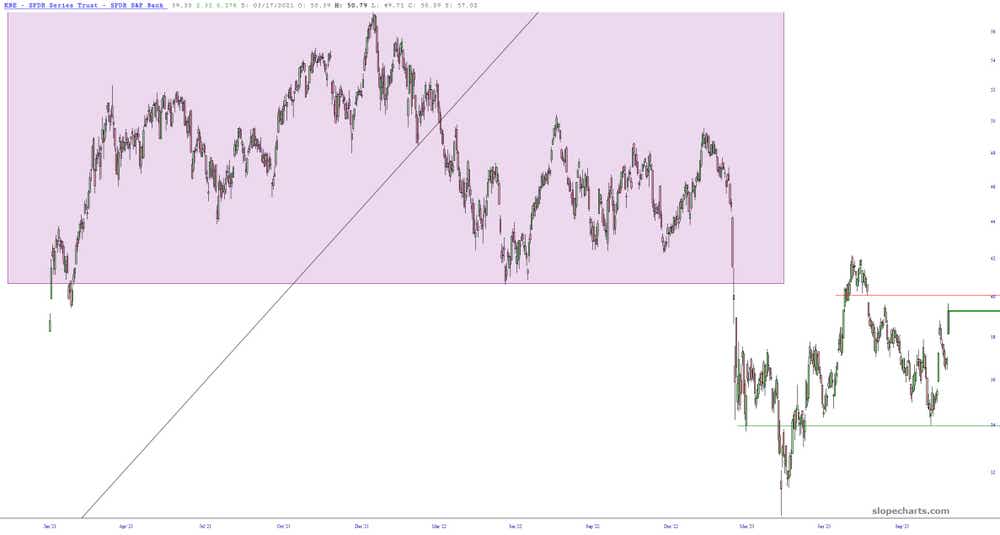
For the past couple of years, the regional banks have had an outsized influence on market direction. Once again we have a price gap to watch—in the form of the horizontal drawn on the chart—as an important resistance barrier.
KBE
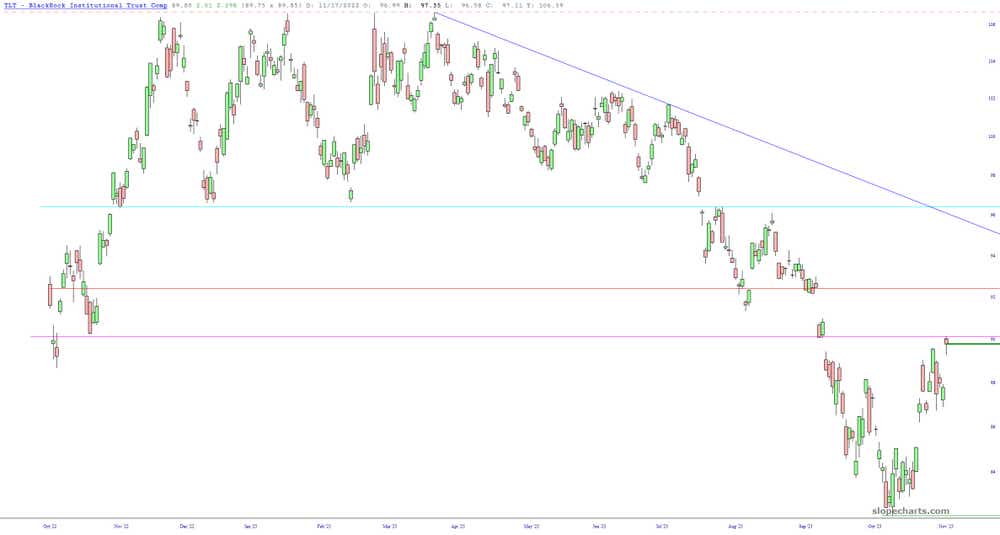
The bond market peaked about four and one half years ago, and although the rally over the past few weeks has been powerful, it does nothing to eradicate the longer-term bearish picture. The price gap here has already been sealed, and if assets are going to weaken at this point, they will probably be led by falling bond prices.
TLT
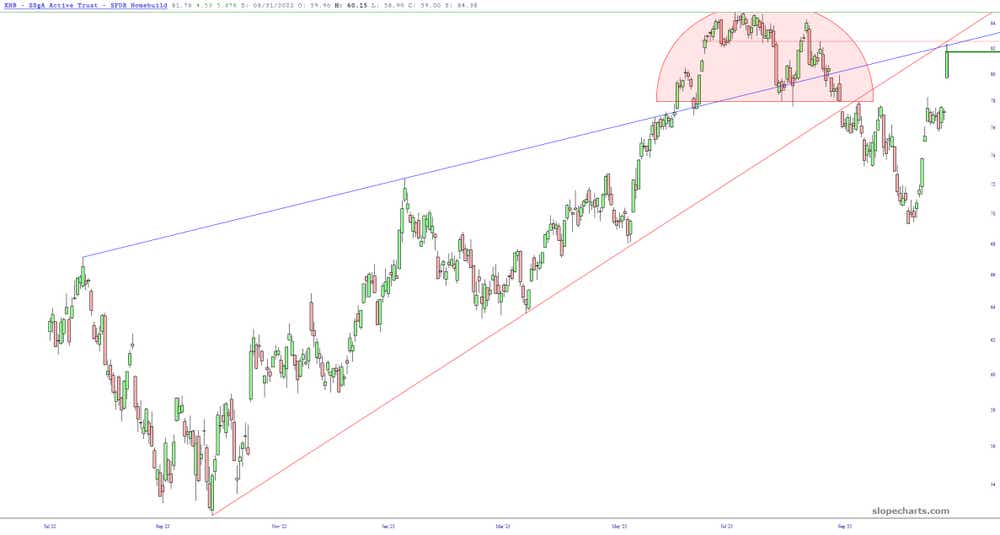
Perhaps the cleanest and most exciting setup of all these charts is in the former of the XHB homebuilders fund. Recent price action has brought it almost precisely to the apex of its already-broken wedge pattern. There could be a violent repulsion of price action from this interaction of the trendlines.
XHB
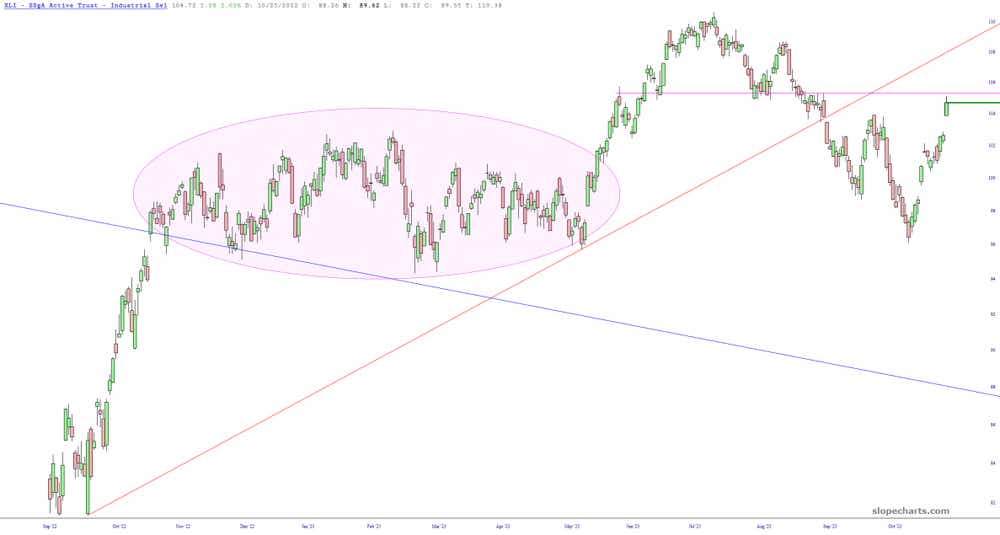
The less well-known "industrials" fund, XLI, is getting close to its own horizontal. This one constituted the base of an inverted cup-with-handle pattern that preceded the powerful sell-off earlier this year.
XLI
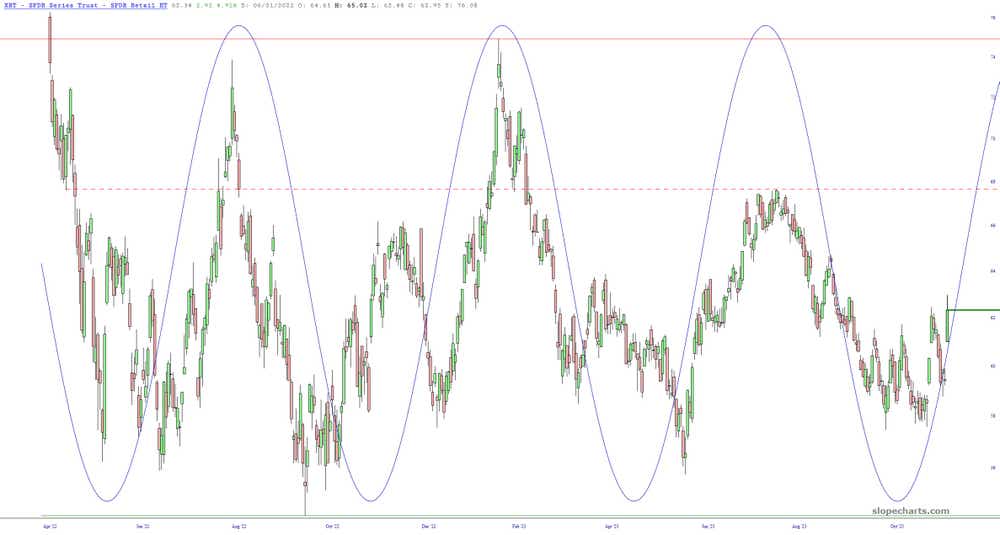
On a bullish note, the retail fund has been following a sinewave pattern with rare regularity, and its especially large leap on yesterday indicates how the gravitational pull of the present position in the sinewave cycle shows just how much sway this "pulse" has on prices.
XRT
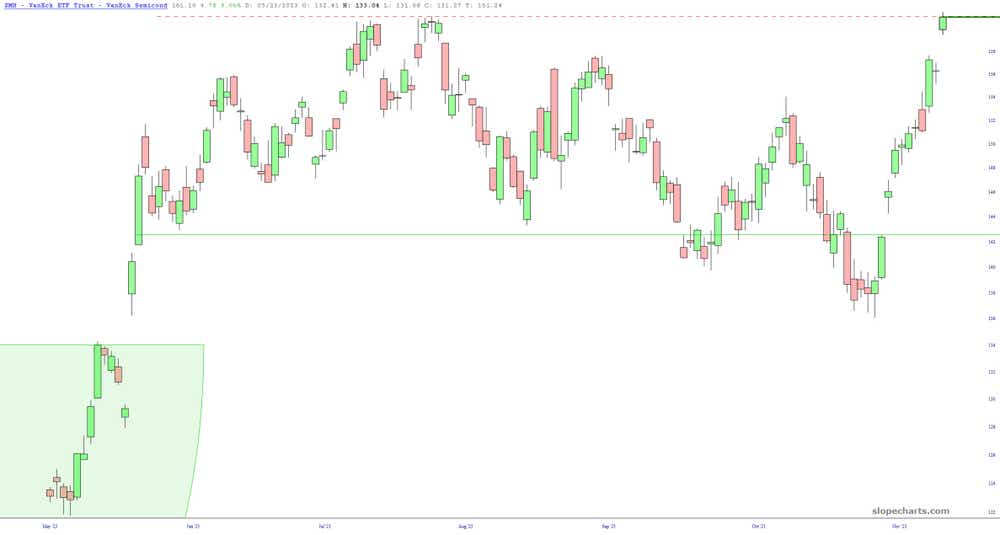
Finally, the semiconductor index reached the highest point in human history, led, as always, by Nvidia. It took many months for the semiconductors to slip from the top of the range to a new low, but it took only a couple of weeks to completely undo all that damage. The key question at this point is whether semiconductors will fault above the range to more new highs. The key decision point for this is what happens with NVDA next Tuesday after the close, when it reports earnings. It’s an event that, in spite of representing just one company out of thousands, will probably move the entire market the following day.
SMH
Tim Knight, a charting analyst with 35 years of trading experience, hosts Trading Charts, a tastylive segment airing Monday-Friday. He founded slopeofhope.com in 2005 and uses it as the basis of his technical charting and analysis. Knight authors The Technician column for Luckbox magazine.
For live daily programming, market news and commentary, visit tastylive or the YouTube channels tastylive (for options traders), and tastyliveTrending for stocks, futures, forex & macro.
Trade with a better broker, open a tastytrade account today. tastylive, Inc. and tastytrade, Inc. are separate but affiliated companies.
Options involve risk and are not suitable for all investors. Please read Characteristics and Risks of Standardized Options before deciding to invest in options.
tastylive content is created, produced, and provided solely by tastylive, Inc. (“tastylive”) and is for informational and educational purposes only. It is not, nor is it intended to be, trading or investment advice or a recommendation that any security, futures contract, digital asset, other product, transaction, or investment strategy is suitable for any person. Trading securities, futures products, and digital assets involve risk and may result in a loss greater than the original amount invested. tastylive, through its content, financial programming or otherwise, does not provide investment or financial advice or make investment recommendations. Investment information provided may not be appropriate for all investors and is provided without respect to individual investor financial sophistication, financial situation, investing time horizon or risk tolerance. tastylive is not in the business of transacting securities trades, nor does it direct client commodity accounts or give commodity trading advice tailored to any particular client’s situation or investment objectives. Supporting documentation for any claims (including claims made on behalf of options programs), comparisons, statistics, or other technical data, if applicable, will be supplied upon request. tastylive is not a licensed financial adviser, registered investment adviser, or a registered broker-dealer. Options, futures, and futures options are not suitable for all investors. Prior to trading securities, options, futures, or futures options, please read the applicable risk disclosures, including, but not limited to, the Characteristics and Risks of Standardized Options Disclosure and the Futures and Exchange-Traded Options Risk Disclosure found on tastytrade.com/disclosures.
tastytrade, Inc. ("tastytrade”) is a registered broker-dealer and member of FINRA, NFA, and SIPC. tastytrade was previously known as tastyworks, Inc. (“tastyworks”). tastytrade offers self-directed brokerage accounts to its customers. tastytrade does not give financial or trading advice, nor does it make investment recommendations. You alone are responsible for making your investment and trading decisions and for evaluating the merits and risks associated with the use of tastytrade’s systems, services or products. tastytrade is a wholly-owned subsidiary of tastylive, Inc.
tastytrade has entered into a Marketing Agreement with tastylive (“Marketing Agent”) whereby tastytrade pays compensation to Marketing Agent to recommend tastytrade’s brokerage services. The existence of this Marketing Agreement should not be deemed as an endorsement or recommendation of Marketing Agent by tastytrade. tastytrade and Marketing Agent are separate entities with their own products and services. tastylive is the parent company of tastytrade.
tastyfx, LLC (“tastyfx”) is a Commodity Futures Trading Commission (“CFTC”) registered Retail Foreign Exchange Dealer (RFED) and Introducing Broker (IB) and Forex Dealer Member (FDM) of the National Futures Association (“NFA”) (NFA ID 0509630). Leveraged trading in foreign currency or off-exchange products on margin carries significant risk and may not be suitable for all investors. We advise you to carefully consider whether trading is appropriate for you based on your personal circumstances as you may lose more than you invest.
tastycrypto is provided solely by tasty Software Solutions, LLC. tasty Software Solutions, LLC is a separate but affiliate company of tastylive, Inc. Neither tastylive nor any of its affiliates are responsible for the products or services provided by tasty Software Solutions, LLC. Cryptocurrency trading is not suitable for all investors due to the number of risks involved. The value of any cryptocurrency, including digital assets pegged to fiat currency, commodities, or any other asset, may go to zero.
© copyright 2013 - 2026 tastylive, Inc. All Rights Reserved. Applicable portions of the Terms of Use on tastylive.com apply. Reproduction, adaptation, distribution, public display, exhibition for profit, or storage in any electronic storage media in whole or in part is prohibited under penalty of law, provided that you may download tastylive’s podcasts as necessary to view for personal use. tastylive was previously known as tastytrade, Inc. tastylive is a trademark/servicemark owned by tastylive, Inc.
Your privacy choices