S&P 500, Nasdaq 100 Retain Bullish Technical Postures

S&P 500, Nasdaq 100 Retain Bullish Technical Postures
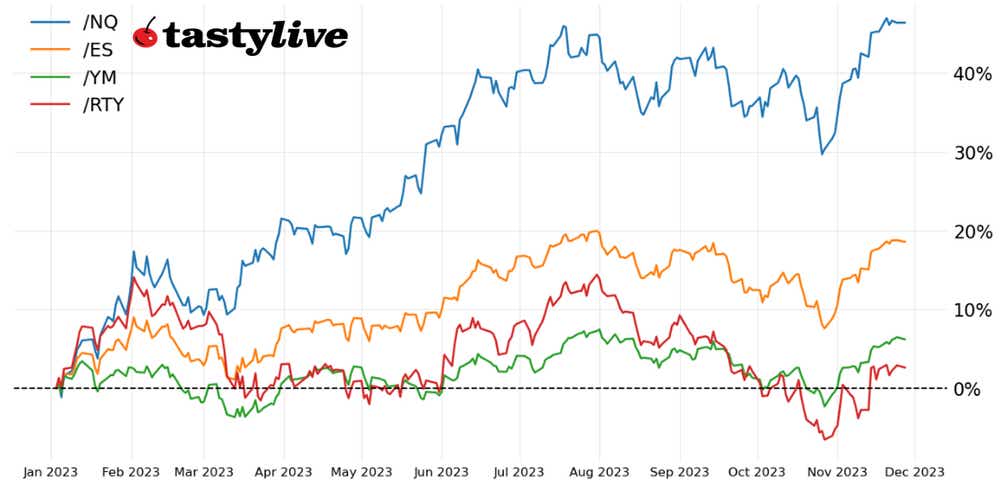
The Nasdaq 100 is up 10.58% month-to-date
- U.S. stock markets are trying for their fifth straight week of gains.
- The S&P 500 (/ESZ3) is hovering around the Sept.15 high (bearish key reversal), while the Nasdaq 100 (/NQZ3) is just below its yearly high.
- The Russell 2000 (/RTYZ3) may be looking at a bottom in the form of an inverse head and shoulders pattern.
On the other side of the holiday week, U.S. equity markets have started off with a relative whimper: no major index has gained nor lost more than +/-0.3% at the time of writing.
Nevertheless, technical structures across the big four remain bullish on a momentum basis, and with measures of volatility continues to stay depressed, quiet earnings and macroeconomic calendars offer few obstacles to derail markets from their current trajectory. A looming announcement from OPEC+ and a Friday speech by Fed Chair Jerome Powell represent the most tangible risks, should any surprises materialize.
/ES S&P 500 price technical analysis: daily chart (September 2022 to November 2023)
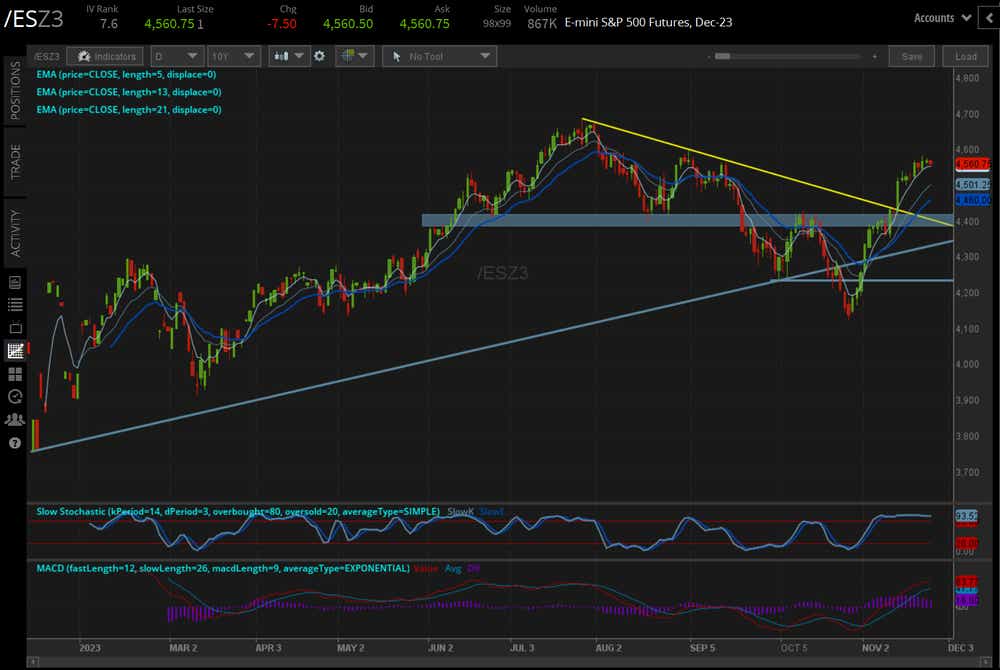
Little has changed for the S&P 500 (/ESZ3) over the past week: momentum is still bullish. /ESZ3 is above its daily 5-, 13-, and 21-day exponential moving average (EMA) envelope, which remains in bullish sequential order; it has not closed below its daily 5-EMA (one-week moving average) since Oct. 31.
Slow stochastics persist in overbought territory and moving average convergence divergence MACD continues to trend upwards above their signal line. The index is levitating around 4566, the Sept. 15 high of the bearish engulfing bar/key reversal. Once clear, as noted last week, “little stands in the way (from a technical perspective) of a return to the yearly high at 4685.25.”
/NQ Nasdaq 100 price technical analysis: daily chart (December 2022 to November 2023)
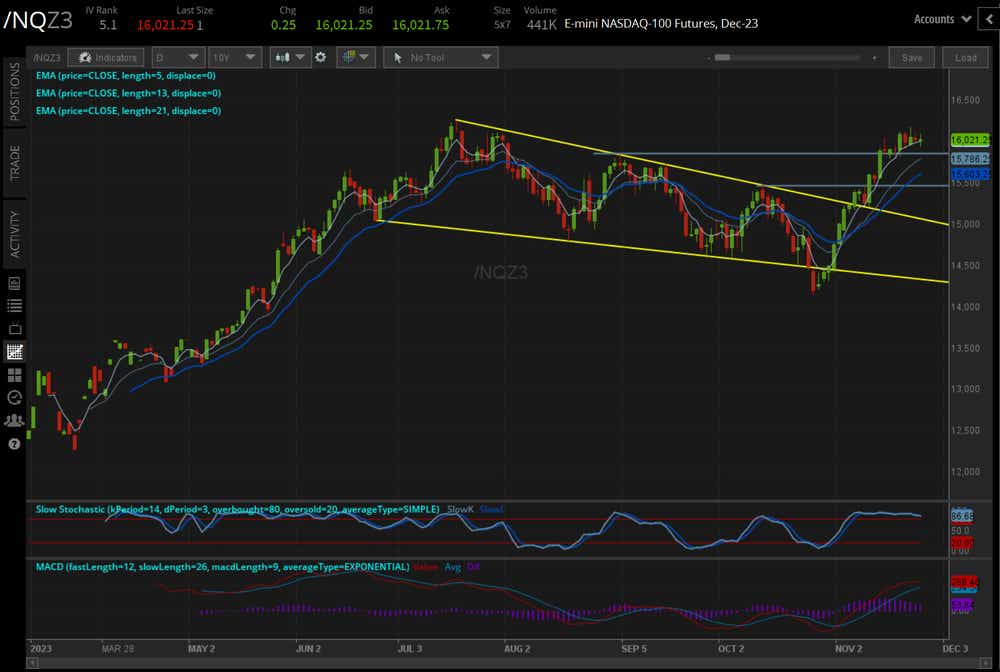
Nothing has changed for the Nasdaq 100 (/NQZ3) since before the Thanksgiving holiday, when the continuous contract, /NQ, and the ETF, QQQ, reclaimed their yearly high set in July. /NQZ3 is not quite there yet. Regardless, momentum is still firmly bullish: /NQZ3 remains above its daily EMA envelope, which is in bullish sequential order; Slow Stochastics are holding in overbought territory, and MACD continues to trend higher above its signal line. As has been the observation for several weeks, “the bullish falling wedge is the primary technical interpretation for the foreseeable future, targeting a return to the yearly high at 16264.25.”
/RTY Russell 2000 price technical analysis: daily chart (April 2023 to November 2023)
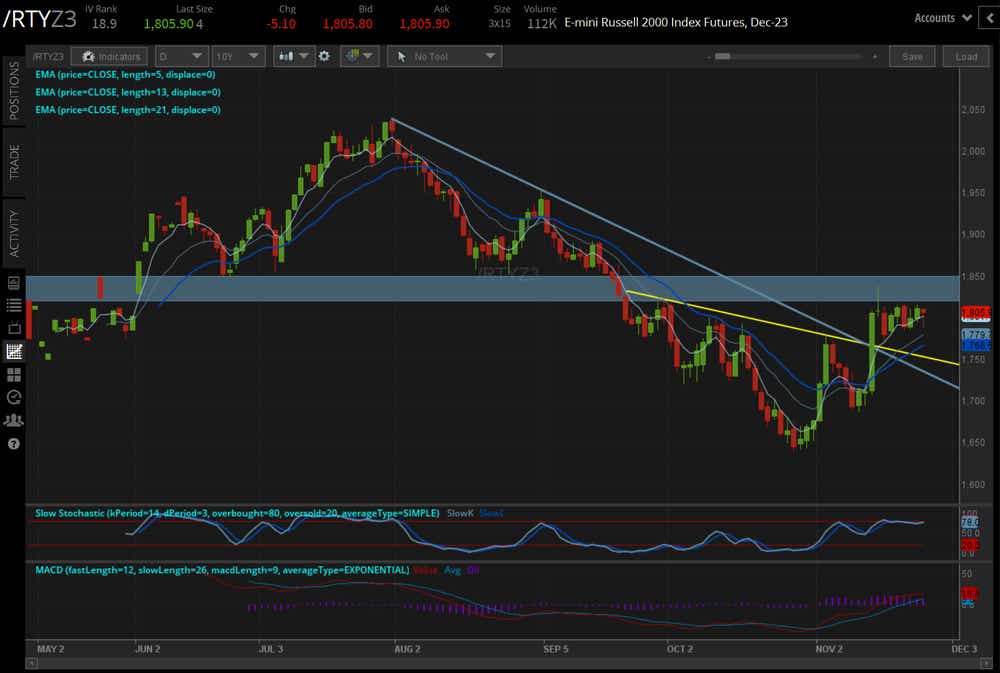
The Russell 2000 (/RTYZ3) has not made much progress or regression in recent days, holding the breakout above the descending trendline from the August and September highs as well as the neckline of an inverse head and shoulders pattern. Familiar resistance around 1820/1850 (which has been both support and resistance since the regional banking crisis in March) remains, the improvement in the momentum profile coupled with the bottoming pattern keeps /RTYZ3 on favorable footing for the near future.
Christopher Vecchio, CFA, tastylive’s head of futures and forex, has been trading for nearly 20 years. He has consulted with multinational firms on FX hedging and lectured at Duke Law School on FX derivatives. Vecchio searches for high-convexity opportunities at the crossroads of macroeconomics and global politics. He hosts Futures Power Hour Monday-Friday and Let Me Explain on Tuesdays, and co-hosts Overtime, Monday-Thursday. @cvecchiofx
For live daily programming, market news and commentary, visit tastylive or the YouTube channels tastylive (for options traders), and tastyliveTrending for stocks, futures, forex & macro.
Trade with a better broker, open a tastytrade account today. tastylive, Inc. and tastytrade, Inc. are separate but affiliated companies.
Options involve risk and are not suitable for all investors. Please read Characteristics and Risks of Standardized Options before deciding to invest in options.
tastylive content is created, produced, and provided solely by tastylive, Inc. (“tastylive”) and is for informational and educational purposes only. It is not, nor is it intended to be, trading or investment advice or a recommendation that any security, futures contract, digital asset, other product, transaction, or investment strategy is suitable for any person. Trading securities, futures products, and digital assets involve risk and may result in a loss greater than the original amount invested. tastylive, through its content, financial programming or otherwise, does not provide investment or financial advice or make investment recommendations. Investment information provided may not be appropriate for all investors and is provided without respect to individual investor financial sophistication, financial situation, investing time horizon or risk tolerance. tastylive is not in the business of transacting securities trades, nor does it direct client commodity accounts or give commodity trading advice tailored to any particular client’s situation or investment objectives. Supporting documentation for any claims (including claims made on behalf of options programs), comparisons, statistics, or other technical data, if applicable, will be supplied upon request. tastylive is not a licensed financial adviser, registered investment adviser, or a registered broker-dealer. Options, futures, and futures options are not suitable for all investors. Prior to trading securities, options, futures, or futures options, please read the applicable risk disclosures, including, but not limited to, the Characteristics and Risks of Standardized Options Disclosure and the Futures and Exchange-Traded Options Risk Disclosure found on tastytrade.com/disclosures.
tastytrade, Inc. ("tastytrade”) is a registered broker-dealer and member of FINRA, NFA, and SIPC. tastytrade was previously known as tastyworks, Inc. (“tastyworks”). tastytrade offers self-directed brokerage accounts to its customers. tastytrade does not give financial or trading advice, nor does it make investment recommendations. You alone are responsible for making your investment and trading decisions and for evaluating the merits and risks associated with the use of tastytrade’s systems, services or products. tastytrade is a wholly-owned subsidiary of tastylive, Inc.
tastytrade has entered into a Marketing Agreement with tastylive (“Marketing Agent”) whereby tastytrade pays compensation to Marketing Agent to recommend tastytrade’s brokerage services. The existence of this Marketing Agreement should not be deemed as an endorsement or recommendation of Marketing Agent by tastytrade. tastytrade and Marketing Agent are separate entities with their own products and services. tastylive is the parent company of tastytrade.
tastyfx, LLC (“tastyfx”) is a Commodity Futures Trading Commission (“CFTC”) registered Retail Foreign Exchange Dealer (RFED) and Introducing Broker (IB) and Forex Dealer Member (FDM) of the National Futures Association (“NFA”) (NFA ID 0509630). Leveraged trading in foreign currency or off-exchange products on margin carries significant risk and may not be suitable for all investors. We advise you to carefully consider whether trading is appropriate for you based on your personal circumstances as you may lose more than you invest.
tastycrypto is provided solely by tasty Software Solutions, LLC. tasty Software Solutions, LLC is a separate but affiliate company of tastylive, Inc. Neither tastylive nor any of its affiliates are responsible for the products or services provided by tasty Software Solutions, LLC. Cryptocurrency trading is not suitable for all investors due to the number of risks involved. The value of any cryptocurrency, including digital assets pegged to fiat currency, commodities, or any other asset, may go to zero.
© copyright 2013 - 2025 tastylive, Inc. All Rights Reserved. Applicable portions of the Terms of Use on tastylive.com apply. Reproduction, adaptation, distribution, public display, exhibition for profit, or storage in any electronic storage media in whole or in part is prohibited under penalty of law, provided that you may download tastylive’s podcasts as necessary to view for personal use. tastylive was previously known as tastytrade, Inc. tastylive is a trademark/servicemark owned by tastylive, Inc.