S&P 500, Nasdaq 100 Rallying Towards Critical Technical Resistance

S&P 500, Nasdaq 100 Rallying Towards Critical Technical Resistance
Market update: The S&P 500 is down 3.33% for the month so far
- The S&P 500 is wrapping up its best week of the year, as is the Nasdaq 100.
- Neither index has traded above former support levels that kept prices elevated in March and early-April, suggesting that bulls aren’t fully back in control.
- Considerable binary event risk remains in the coming days, with Amazon earnings on Tuesday and the May FOMC meeting on Wednesday.
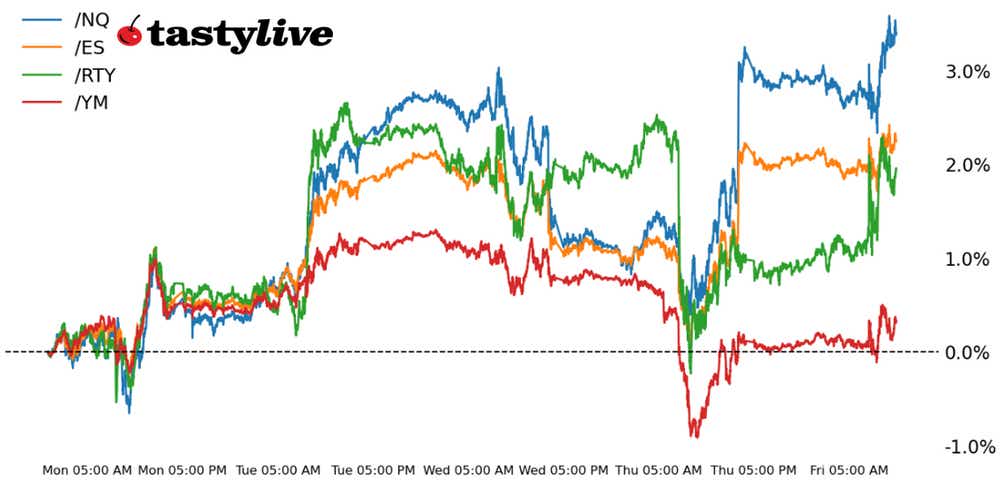
April has been a bad month for stocks, although you can’t blame this week. It’s been the best one thus far in 2024 for both the S&P 500 (/ESM4) and Nasdaq 100 (/NQM4).
First-quarter U.S. GDP data and the March U.S. personal consumption expenditures (PCE) price index did little to rock the boat, and the overall sweep of earnings in recent days has been received positively by investors.
Fear rules
Nevertheless, sentiment remains damaged even as volatility has contracted in recent days. The AAII Investor Sentiment survey showed a 0% bull-bear spread for the most recent reading, while the CNN Fear and Greed Index is still issuing a "fear" reading.
The lack of belief in the rebound may be a sign that bulls still have some work to do, and indeed, there are technical reasons to believe that equity markets aren’t out of the woods just yet. Critical overhead resistance looms for both /ESM4 and /NQM4, former support that defined swing lows throughout March and early-April.
/ES S&P 500 price technical analysis: daily chart (October 2023 to April 2024)
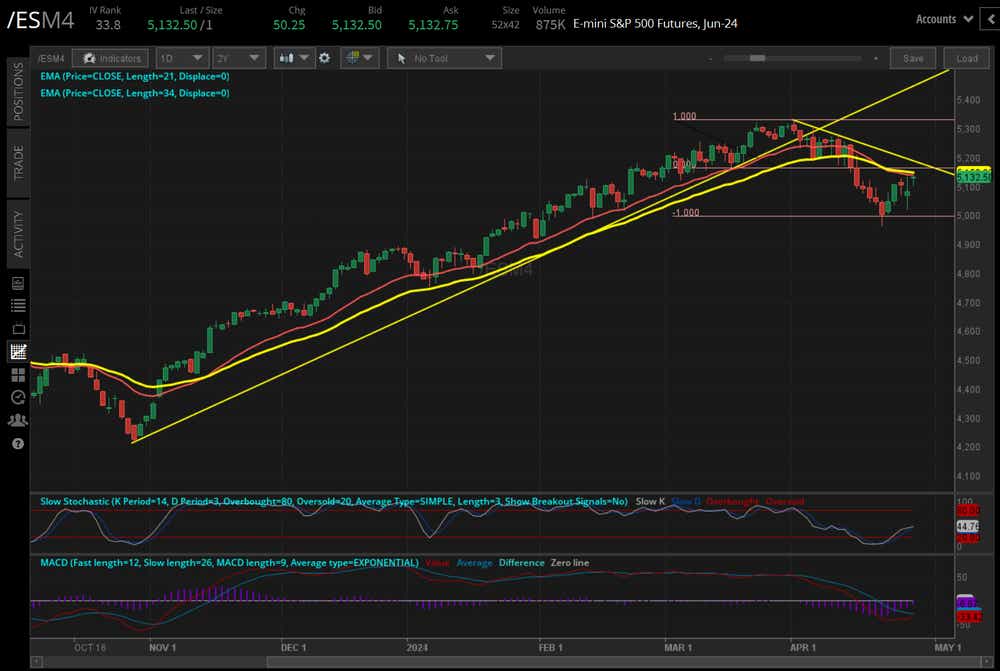
In the update on April 11, we noted “price action in [the S&P 500] /ESM4 has formed a head and shoulders pattern with a 166.25 measured move calling for a drop to 5000.25. From a technical perspective, there’s little to like from the long side until a deeper setback transpires.”
Then, on April 16 we observed that “the name of the game right now in /ESM4 is patience: bulls have a better shot above 5125; otherwise, the path of least resistance appears to be a decline to 5000.25.”
Ultimately, the bears won out in the short-term, driving /ESM4 to a low of 4963.50 before closing last week at 5003.75—just above the head and shoulders target.
The question in front of us now is whether the low from mid-April is a low or the low. And the answer on the charts may not be far away. The head and shoulders neckline came in at 5167.25
The daily 21-/34-exponential moving average (EMA) cloud support from early-November 2023 through mid-April 2024, is now resistance between 5140/50. /ESM4 is effectively facing a zone between 5140/70 that if it can break through, an important low would have been established that may pave the way for a return to the yearly high.
However, if /ESM4 fails to trade through 5140/70 over the coming sessions, traders must not rule out a return to the April low at 4963.50. Decision time nears for what very well may determine the next 200 points in /ESM4.
/NQ Nasdaq 100 price technical analysis: daily chart (October 2023 to April 2024)
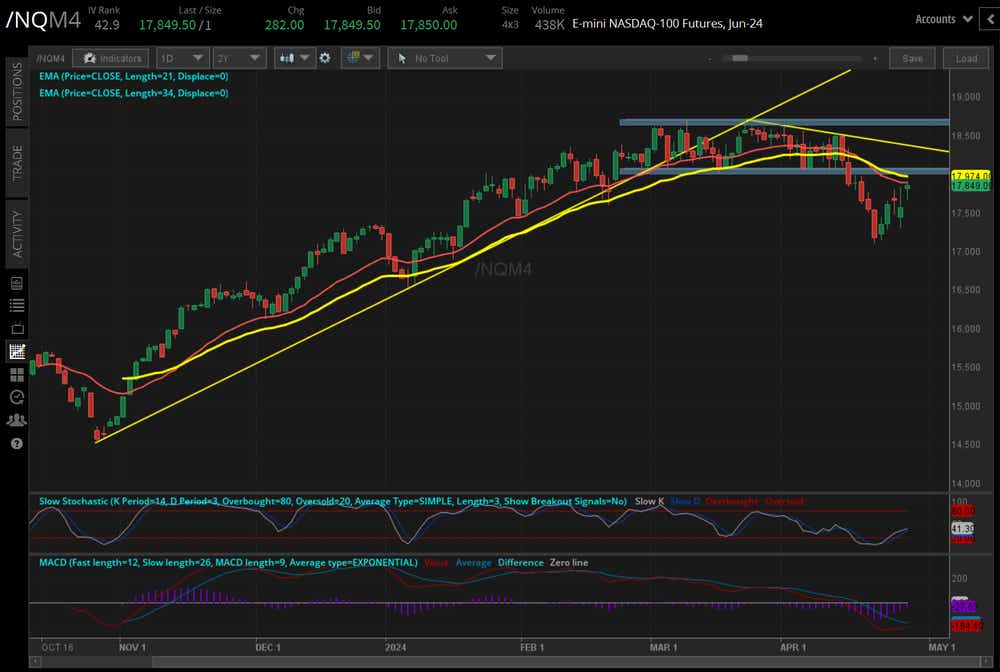
Previous commentary on the Nasdaq 100 (/NQM4) stipulated that the 18000-18700 range offered directional outcomes for bulls above 18700 and for bears below 18000; with a 700-point range, this would look for /NQM4 to rally to 19400 or drop to 17300.
The latter scenario played out with some overshoot last week, and now /NQM4 is racing back towards multi-month range support near 18000. Similar to /ESM4, /NQM4 also has its daily 21-/34-EMA cloud looming ahead near 17891/981, creating a zone of resistance between 17890/18000. A return above this area would reinforce the bottoming narrative; failure here would suggest that the rally over the past week has been a bull trap, with new lows likely around the corner.
/RTY Russell 2000 price technical analysis: daily chart (October 2023 to April 2024)
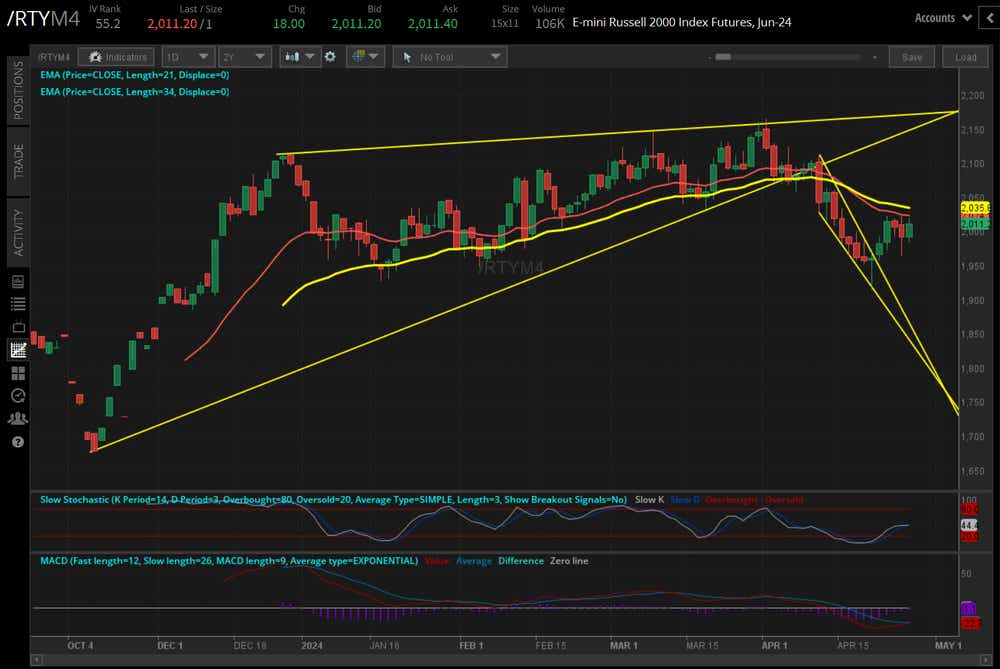
For concerns about the viability of the recent rallies in /ESM4 and /NQM4 (because of their daily 21-/34-EMA clouds looming overhead as resistance), one needs to look no further than the Russell 2000 (/RTYM4) to see this dynamic already playing out.
For the fourth day in a row, /RTYM4 has been stuck below its daily 21-/34-EMA cloud, unable to breach former trend support turned resistance. Volatility is higher here (IVR: 55.2) than in either /ESM4 (IVR: 33.8) and /NQM4 (IVR: 42.9), which makes expressing bullish directional bets more appropriate through selling puts rather than buying calls.
Nevertheless, until /RTYM4 clears the area between 2024/35, it’s difficult to distinguish, on a technical basis, whether the recent rally has continuation potential. Failure to clear 2024/35 puts the April low at 1915.8 back into play.
Christopher Vecchio, CFA, tastylive’s head of futures and forex, has been trading for nearly 20 years. He has consulted with multinational firms on FX hedging and lectured at Duke Law School on FX derivatives. Vecchio searches for high-convexity opportunities at the crossroads of macroeconomics and global politics. He hosts Futures Power Hour Monday-Friday and Let Me Explain on Tuesdays, and co-hosts Overtime, Monday-Thursday. @cvecchiofx
For live daily programming, market news and commentary, visit tastylive or the YouTube channels tastylive (for options traders), and tastyliveTrending for stocks, futures, forex & macro.
Trade with a better broker, open a tastytrade account today. tastylive, Inc. and tastytrade, Inc. are separate but affiliated companies.
Options involve risk and are not suitable for all investors. Please read Characteristics and Risks of Standardized Options before deciding to invest in options.
tastylive content is created, produced, and provided solely by tastylive, Inc. (“tastylive”) and is for informational and educational purposes only. It is not, nor is it intended to be, trading or investment advice or a recommendation that any security, futures contract, digital asset, other product, transaction, or investment strategy is suitable for any person. Trading securities, futures products, and digital assets involve risk and may result in a loss greater than the original amount invested. tastylive, through its content, financial programming or otherwise, does not provide investment or financial advice or make investment recommendations. Investment information provided may not be appropriate for all investors and is provided without respect to individual investor financial sophistication, financial situation, investing time horizon or risk tolerance. tastylive is not in the business of transacting securities trades, nor does it direct client commodity accounts or give commodity trading advice tailored to any particular client’s situation or investment objectives. Supporting documentation for any claims (including claims made on behalf of options programs), comparisons, statistics, or other technical data, if applicable, will be supplied upon request. tastylive is not a licensed financial adviser, registered investment adviser, or a registered broker-dealer. Options, futures, and futures options are not suitable for all investors. Prior to trading securities, options, futures, or futures options, please read the applicable risk disclosures, including, but not limited to, the Characteristics and Risks of Standardized Options Disclosure and the Futures and Exchange-Traded Options Risk Disclosure found on tastytrade.com/disclosures.
tastytrade, Inc. ("tastytrade”) is a registered broker-dealer and member of FINRA, NFA, and SIPC. tastytrade was previously known as tastyworks, Inc. (“tastyworks”). tastytrade offers self-directed brokerage accounts to its customers. tastytrade does not give financial or trading advice, nor does it make investment recommendations. You alone are responsible for making your investment and trading decisions and for evaluating the merits and risks associated with the use of tastytrade’s systems, services or products. tastytrade is a wholly-owned subsidiary of tastylive, Inc.
tastytrade has entered into a Marketing Agreement with tastylive (“Marketing Agent”) whereby tastytrade pays compensation to Marketing Agent to recommend tastytrade’s brokerage services. The existence of this Marketing Agreement should not be deemed as an endorsement or recommendation of Marketing Agent by tastytrade. tastytrade and Marketing Agent are separate entities with their own products and services. tastylive is the parent company of tastytrade.
tastyfx, LLC (“tastyfx”) is a Commodity Futures Trading Commission (“CFTC”) registered Retail Foreign Exchange Dealer (RFED) and Introducing Broker (IB) and Forex Dealer Member (FDM) of the National Futures Association (“NFA”) (NFA ID 0509630). Leveraged trading in foreign currency or off-exchange products on margin carries significant risk and may not be suitable for all investors. We advise you to carefully consider whether trading is appropriate for you based on your personal circumstances as you may lose more than you invest.
tastycrypto is provided solely by tasty Software Solutions, LLC. tasty Software Solutions, LLC is a separate but affiliate company of tastylive, Inc. Neither tastylive nor any of its affiliates are responsible for the products or services provided by tasty Software Solutions, LLC. Cryptocurrency trading is not suitable for all investors due to the number of risks involved. The value of any cryptocurrency, including digital assets pegged to fiat currency, commodities, or any other asset, may go to zero.
© copyright 2013 - 2026 tastylive, Inc. All Rights Reserved. Applicable portions of the Terms of Use on tastylive.com apply. Reproduction, adaptation, distribution, public display, exhibition for profit, or storage in any electronic storage media in whole or in part is prohibited under penalty of law, provided that you may download tastylive’s podcasts as necessary to view for personal use. tastylive was previously known as tastytrade, Inc. tastylive is a trademark/servicemark owned by tastylive, Inc.
Your privacy choices