S&P 500: From 19% Down to Record Highs in Six Charts

S&P 500: From 19% Down to Record Highs in Six Charts
By:Kai Zeng
Making sense of the market’s quickest fear-to-greed flip in decades
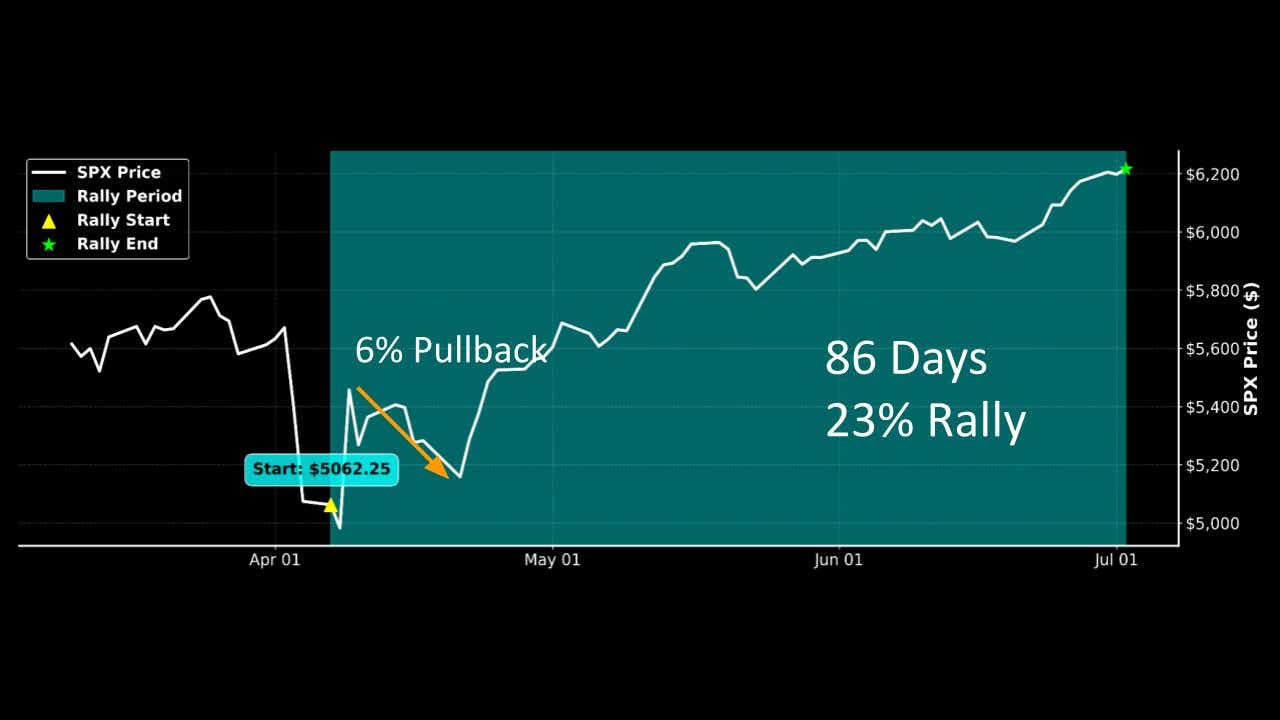
The S&P 500's remarkable 86-day rally to new highs represents the third-fastest recovery since 2000, featuring unprecedented normalization of the VIX and minimal pullbacks during a 23% climb from bottom to top.
The S&P 500 has reached $6,300, hitting new all-time highs and surpassing February's previous record by 1%. What makes this achievement remarkable is the speed of recovery — the market climbed back in less than three months, one of the quickest recoveries in recent history.
Rally performance breakdown
This 86-day rally delivered a 23% gain from bottom to top with exceptional consistency throughout the move. The largest pullback during the entire rally was just 6% (April 9-21), demonstrating unusual stability for such a strong upward trajectory. This level of consistency is rare in major market rallies, where volatility typically increases during significant moves. For context, the previous correction dropped 19% from February to April before this recovery began.
Historical context
We analyzed similar market events using rigorous criteria:
- Gains of at least 20% two months
- No pullback larger than 6%
- No overlapping periods
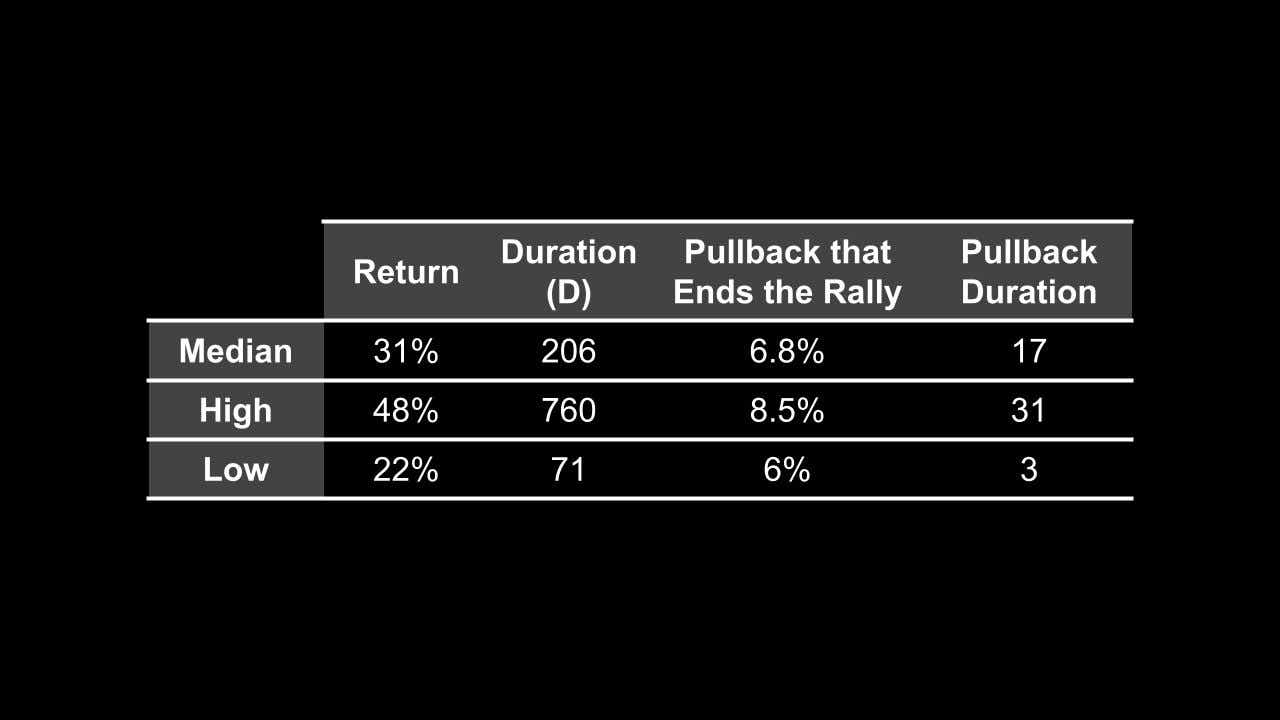
This methodology ensures we're comparing truly exceptional rallies, not just ordinary market moves. The search yielded only 11 comparable events in the past 20 years, highlighting the rarity of these recoveries.
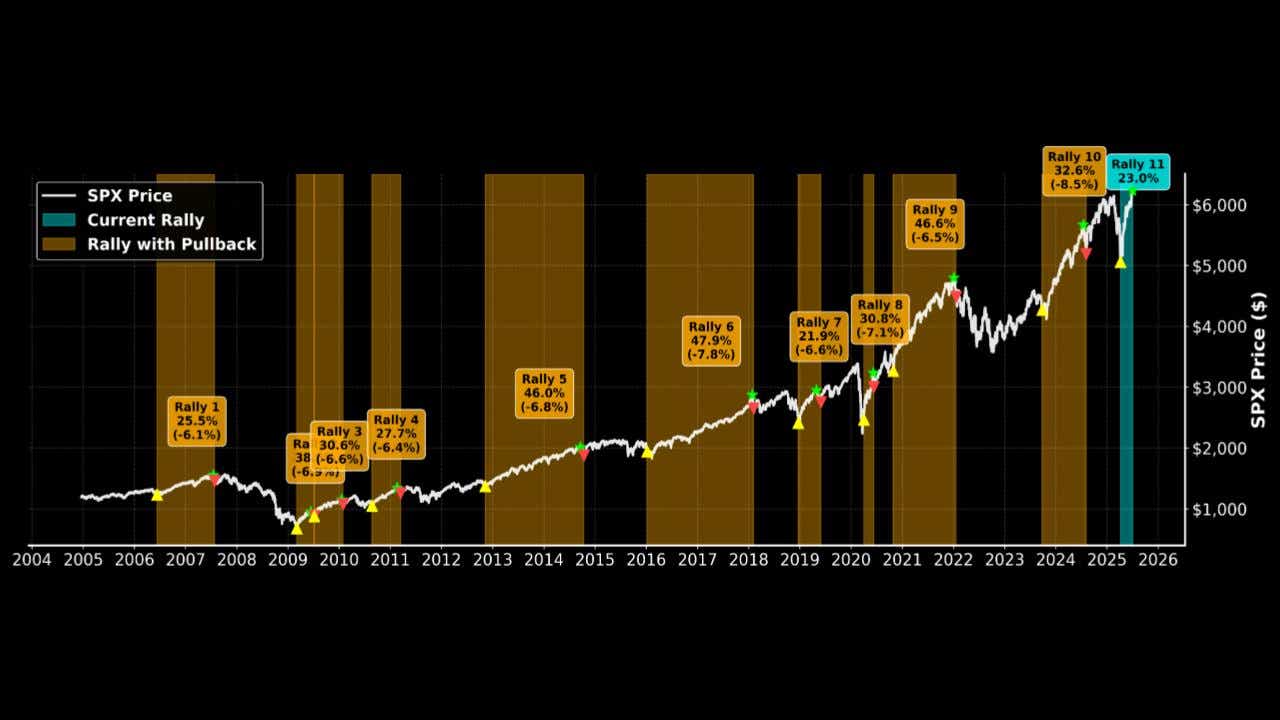
This rally ranks as the third-fastest rebound from a market bottom, trailing only the 2009 financial crisis recovery and 2020's pandemic rebound. While smaller in magnitude than the historical median of 31% over 206 days, its speed places it among notable recoveries in market history.
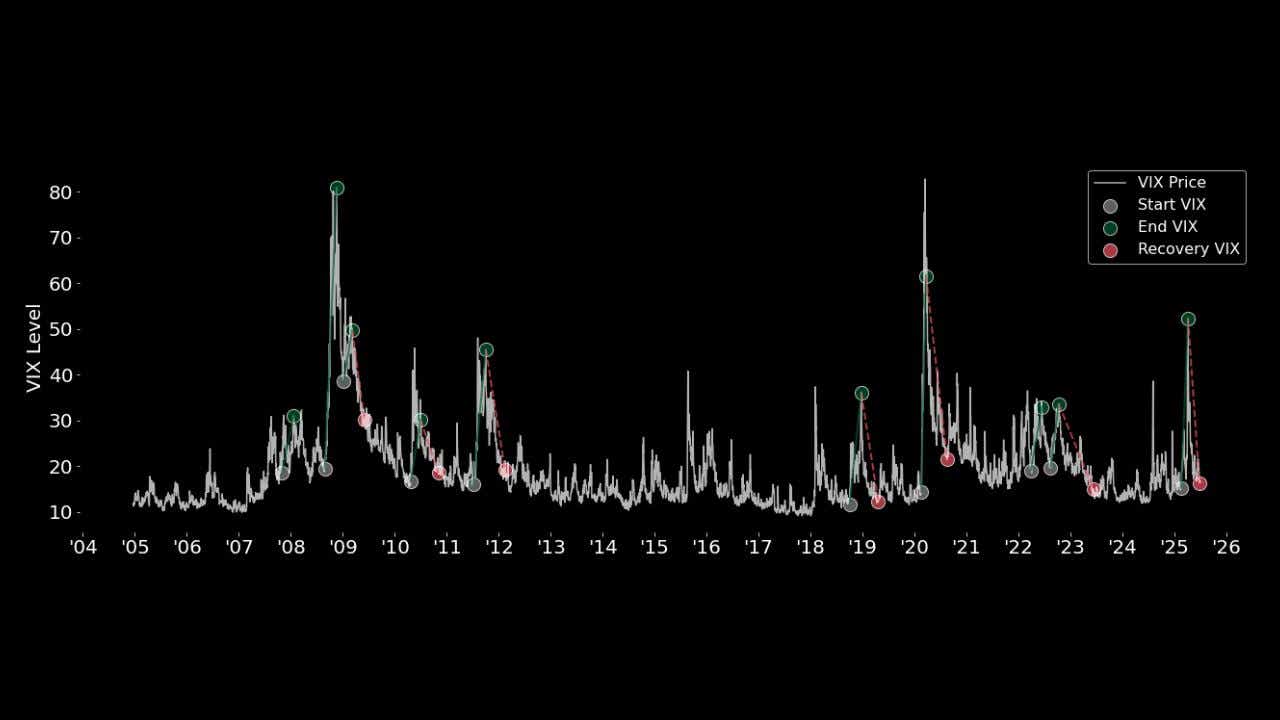
Volatility tells the story
The volatility pattern tells perhaps the most compelling story of this rally. The initial spike in fear that preceded it was the third-largest and fastest after the 2008 financial crisis and 2020 pandemic crash, indicating significant distress in the market.
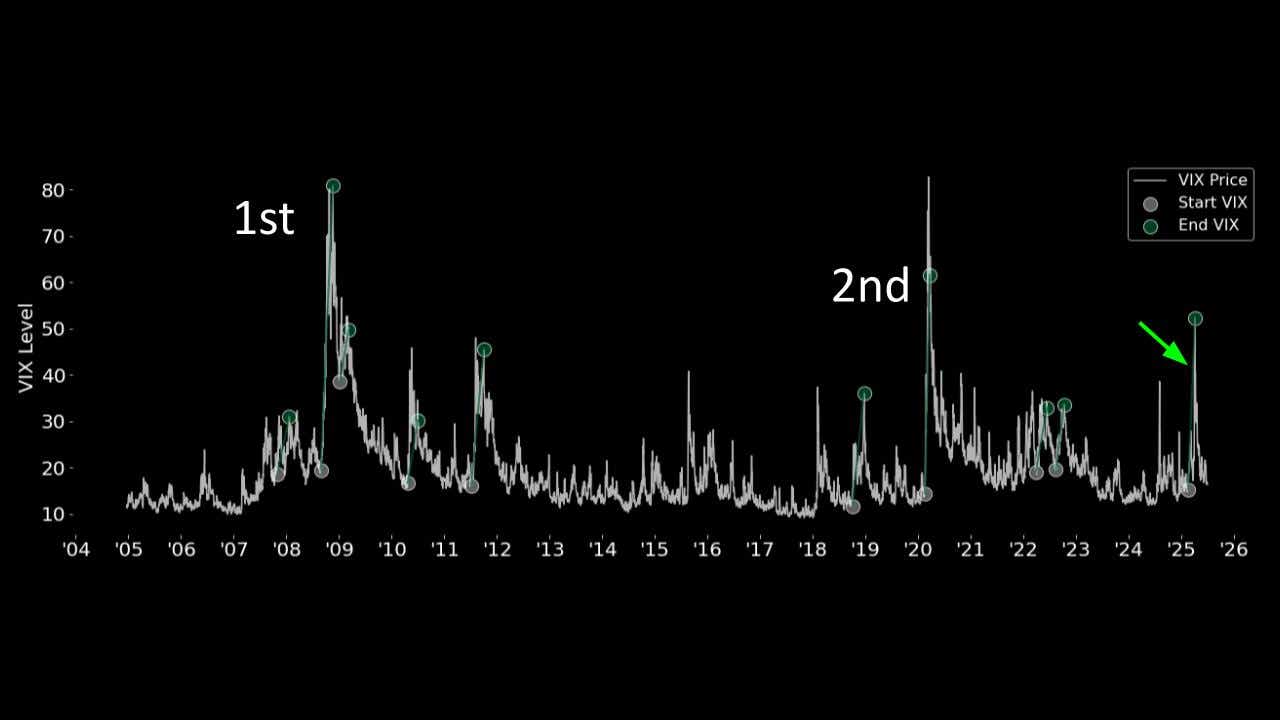
However, the subsequent decline was record-breaking in its speed. The 36-point drop in the VIX in 90 days was the fastest on record, outpacing even the celebrated 2020 and 2008 recoveries that traders still reference today.
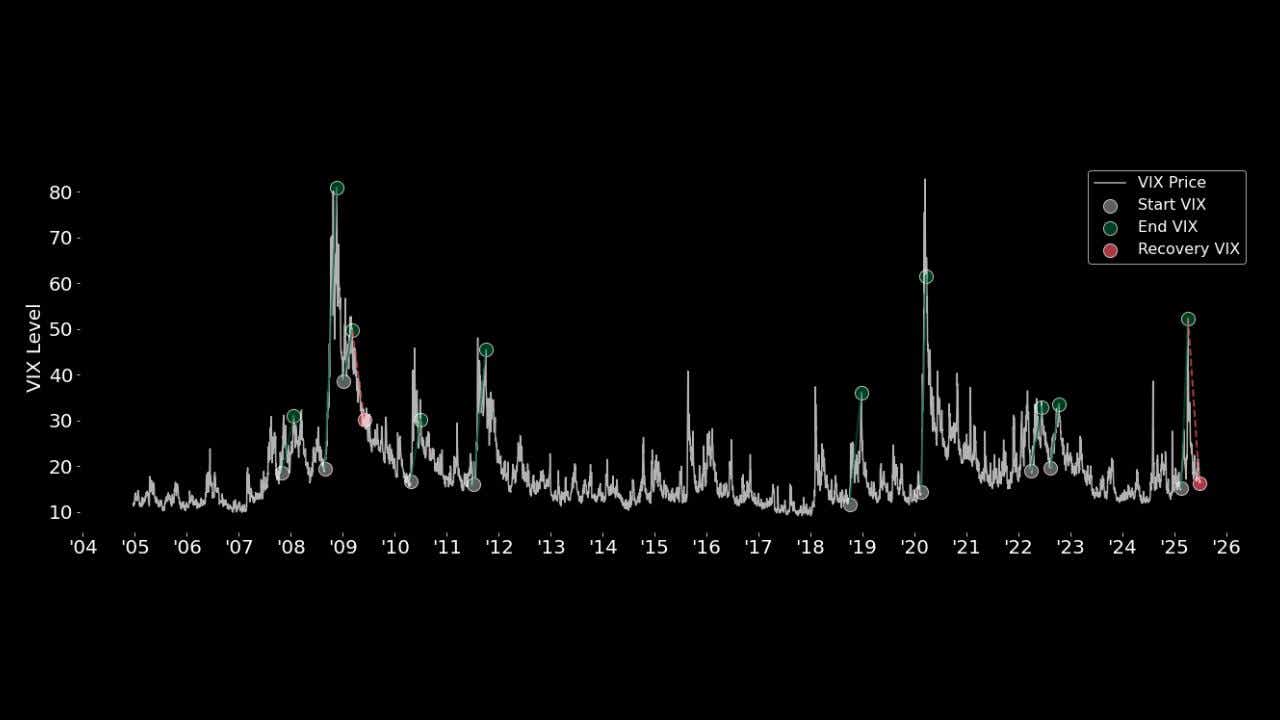
Expanding to a 365-day window reveals more context. This decline in the VIX ranks as the second-largest after 2020, while remaining the fastest in two decades — showing how quickly fear was transformed into confidence.
Key Takeaways
This rally demonstrates three critical characteristics. First, it has been remarkably smooth with only minor interruptions. Second, the normalization of the VIX suggests genuine restoration of confidence instead of just temporary relief. Finally, while this rally remains smaller than historical averages, it hasn't finished yet — a crucial consideration for traders planning positions and timing decisions.
Kai Zeng, director of the research team and head of Chinese content at tastylive, has 20 years of experience in markets and derivatives trading. He cohosts several live shows, including From Theory to Practice and Building Blocks. @kai_zeng1
For live daily programming, market news and commentary, visit tastylive or the YouTube channels tastylive (for options traders), and tastyliveTrending for stocks, futures, forex & macro.
Trade with a better broker, open a tastytrade account today. tastylive, Inc. and tastytrade, Inc. are separate but affiliated companies.
Options involve risk and are not suitable for all investors. Please read Characteristics and Risks of Standardized Options before deciding to invest in options.
tastylive content is created, produced, and provided solely by tastylive, Inc. (“tastylive”) and is for informational and educational purposes only. It is not, nor is it intended to be, trading or investment advice or a recommendation that any security, futures contract, digital asset, other product, transaction, or investment strategy is suitable for any person. Trading securities, futures products, and digital assets involve risk and may result in a loss greater than the original amount invested. tastylive, through its content, financial programming or otherwise, does not provide investment or financial advice or make investment recommendations. Investment information provided may not be appropriate for all investors and is provided without respect to individual investor financial sophistication, financial situation, investing time horizon or risk tolerance. tastylive is not in the business of transacting securities trades, nor does it direct client commodity accounts or give commodity trading advice tailored to any particular client’s situation or investment objectives. Supporting documentation for any claims (including claims made on behalf of options programs), comparisons, statistics, or other technical data, if applicable, will be supplied upon request. tastylive is not a licensed financial adviser, registered investment adviser, or a registered broker-dealer. Options, futures, and futures options are not suitable for all investors. Prior to trading securities, options, futures, or futures options, please read the applicable risk disclosures, including, but not limited to, the Characteristics and Risks of Standardized Options Disclosure and the Futures and Exchange-Traded Options Risk Disclosure found on tastytrade.com/disclosures.
tastytrade, Inc. ("tastytrade”) is a registered broker-dealer and member of FINRA, NFA, and SIPC. tastytrade was previously known as tastyworks, Inc. (“tastyworks”). tastytrade offers self-directed brokerage accounts to its customers. tastytrade does not give financial or trading advice, nor does it make investment recommendations. You alone are responsible for making your investment and trading decisions and for evaluating the merits and risks associated with the use of tastytrade’s systems, services or products. tastytrade is a wholly-owned subsidiary of tastylive, Inc.
tastytrade has entered into a Marketing Agreement with tastylive (“Marketing Agent”) whereby tastytrade pays compensation to Marketing Agent to recommend tastytrade’s brokerage services. The existence of this Marketing Agreement should not be deemed as an endorsement or recommendation of Marketing Agent by tastytrade. tastytrade and Marketing Agent are separate entities with their own products and services. tastylive is the parent company of tastytrade.
tastyfx, LLC (“tastyfx”) is a Commodity Futures Trading Commission (“CFTC”) registered Retail Foreign Exchange Dealer (RFED) and Introducing Broker (IB) and Forex Dealer Member (FDM) of the National Futures Association (“NFA”) (NFA ID 0509630). Leveraged trading in foreign currency or off-exchange products on margin carries significant risk and may not be suitable for all investors. We advise you to carefully consider whether trading is appropriate for you based on your personal circumstances as you may lose more than you invest.
tastycrypto is provided solely by tasty Software Solutions, LLC. tasty Software Solutions, LLC is a separate but affiliate company of tastylive, Inc. Neither tastylive nor any of its affiliates are responsible for the products or services provided by tasty Software Solutions, LLC. Cryptocurrency trading is not suitable for all investors due to the number of risks involved. The value of any cryptocurrency, including digital assets pegged to fiat currency, commodities, or any other asset, may go to zero.
© copyright 2013 - 2026 tastylive, Inc. All Rights Reserved. Applicable portions of the Terms of Use on tastylive.com apply. Reproduction, adaptation, distribution, public display, exhibition for profit, or storage in any electronic storage media in whole or in part is prohibited under penalty of law, provided that you may download tastylive’s podcasts as necessary to view for personal use. tastylive was previously known as tastytrade, Inc. tastylive is a trademark/servicemark owned by tastylive, Inc.
Your privacy choices