S&P 500, Nasdaq 100 Technicals: Stuck in Multi-Month Triangles

S&P 500, Nasdaq 100 Technicals: Stuck in Multi-Month Triangles
Market Update: S&P 500 up +1.29% year-to-date
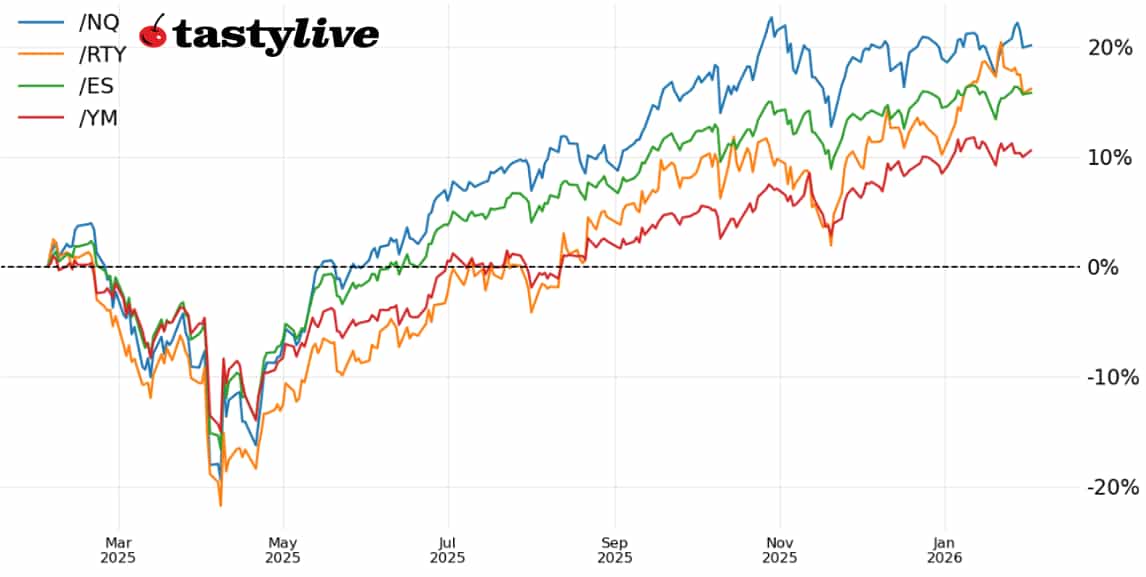
Fig. 1: Rolling 1-year (02/02/26-present) percent change chart for /ES, /NQ, /RTY, and /YM
Article Key Takeaways:
- Both the S&P 500 (/ESH6) and Nasdaq 100 (/NQH6) are trapped in multi-month triangles; bullish potential remains.
- The Russell 2000 (/RTYH6) is regaining bullish posture as a shorter-term head and shoulders pattern has run its course.
- Earnings growth remains strong (4Q’25 on track for the fifth consecutive quarter of double digits earnings growth) but February seasonality isn’t helpful.
The start to 2026 has been positive, if uneven, for U.S. equity markets. While all four major indexes produced gains in January, that says little about the weekend gap risk faced by traders throughout the month on the back of policy uncertainty – geopolitical (Greenland, Iran), fiscal (government shutdown), and monetary (Federal Reserve subpoenas, Kevin Warsh nomination). Those meager gains (S&P 500 (/ESH6) gained +1.06%) were hard-fought; will stocks continue to show their resiliency as the page turns to February?
Bulls may have some history to fight against. February is typically a weaker month for stocks, with the S&P 500 averaging a loss of -0.55% over the past 10 years. Likewise, February over the past decade has produced a jump in volatility, with the VIX moving higher seven times during that time span (putting it on par with October as the month with the most consistent volatility expansion).
/ES S&P 500 Price Technical Analysis: Daily Chart (July 2025 to February 2026)
The S&P 500 (/ESH6) is in a familiar place, remaining in an uptrend from the late-November lows while holding in a broader, multi-month range that began in September. The triangular nature of the consolidation, with clear resistance north of 7000, has evolved in the context of a bull market, which suggests continuation to the upside. Sell-offs in /ESH6 have been supported by the area between the daily 21-EMA (one-month exponential moving average) and the daily 50-EMA. The sideways chop has lent to Slow Stochastics starting to dip out of overbought territory, but recent price action is likewise on the cusp of triggering a bullish crossover in MACD whilst above its signal line. A breach of the all-time high at 7043 would suggest that the consolidation has ended and the next leg higher, towards a measured target above 7400, is under way.
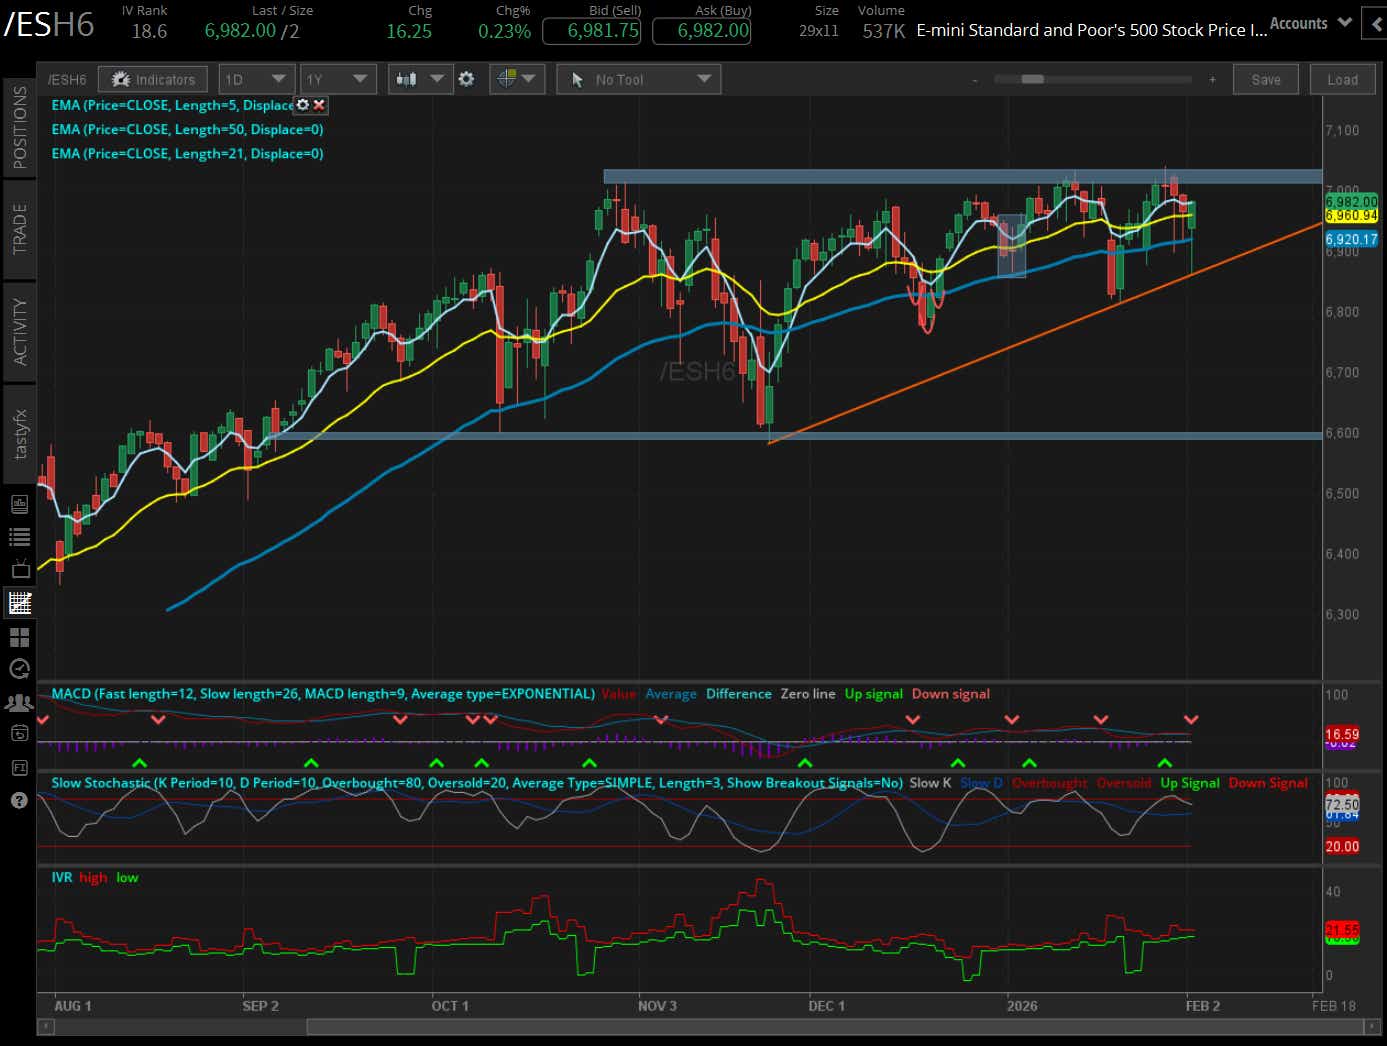
| Strategy: (46DTE, ATM) | Strikes | POP | Max Profit | Max Loss |
| Iron Condor | Long 6500 p Short 6550 p Short 7450 c Long 7500 c | 67% | +387.50 | -2112.50 |
| Short Strangle | Short 6550 p Short 7450 c | 71% | +2550 | x |
| Short Put Vertical | Long 6500 p Short 6550 p | 85% | +225 | -2275 |
/NQ Nasdaq 100 Price Technical Analysis: Daily Chart (August 2025 to February 2026)
Like /ESH6, the Nasdaq 100 (/NQH6) is stuck in the confines of a multi-month triangle. Similarly, /NQH6 has been supported by the area around the daily 21-EMA and 50-EMA in recent months (although breaches have been more severe). However, unlike /ESH6, /NQH6 is not close to breaking above resistance. Furthermore, /NQH6 has a much weaker momentum profile (EMA cloud shows little positive rate of change; MACD and Slow Stochastics still trending lower). Momentum traders may find frustration until /NQH6 either loses 25000 or breaches 26750; range traders may find the current setup a bit more opportunistic.
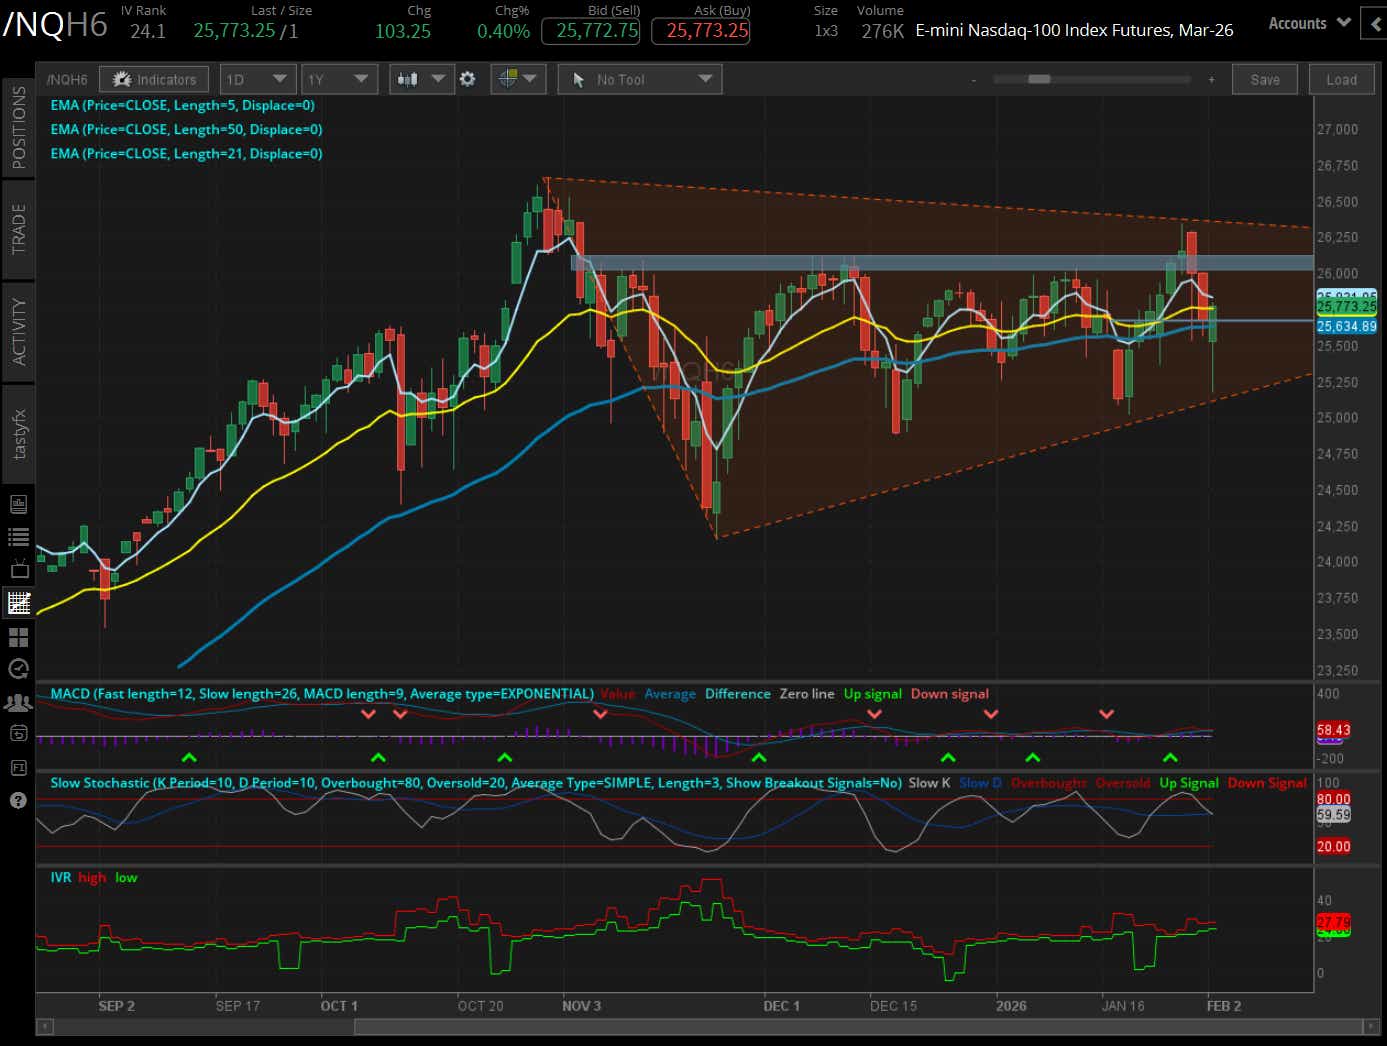
| Strategy: (46DTE, ATM) | Strikes | POP | Max Profit | Max Loss |
| Iron Condor | Long 23750 p Short 24000 p Short 28250 c Long 29000 c | 67% | +835 | -4165 |
| Short Strangle | Short 24000 p Short 28250 c | 72% | +5160 | x |
| Short Put Vertical | Long 23750 p Short 24000 p | 85% | +575 | -4425 |
/RTY Russell 2000 Price Technical Analysis: Daily Chart (August 2025 to January 2026)
The Russell 2000 (/RTYH6) has been a leader this year, both on the way up through mid-January and on the way down in the second half of the month. Seasonally, small caps have fared better than their mega cap counterparts, so there may be some juice to help the rotation from late-November onwards to continue. Now that /RTYH6 has rebounded from its daily 50-EMA (and a culmination of a shorter-term head and shoulders pattern off the 2026 high), it finds itself trading back through the 2025 high. For dip buyers, this may prove to be an appealing situation if /RTYH6 is able to sustain a close above 2605.
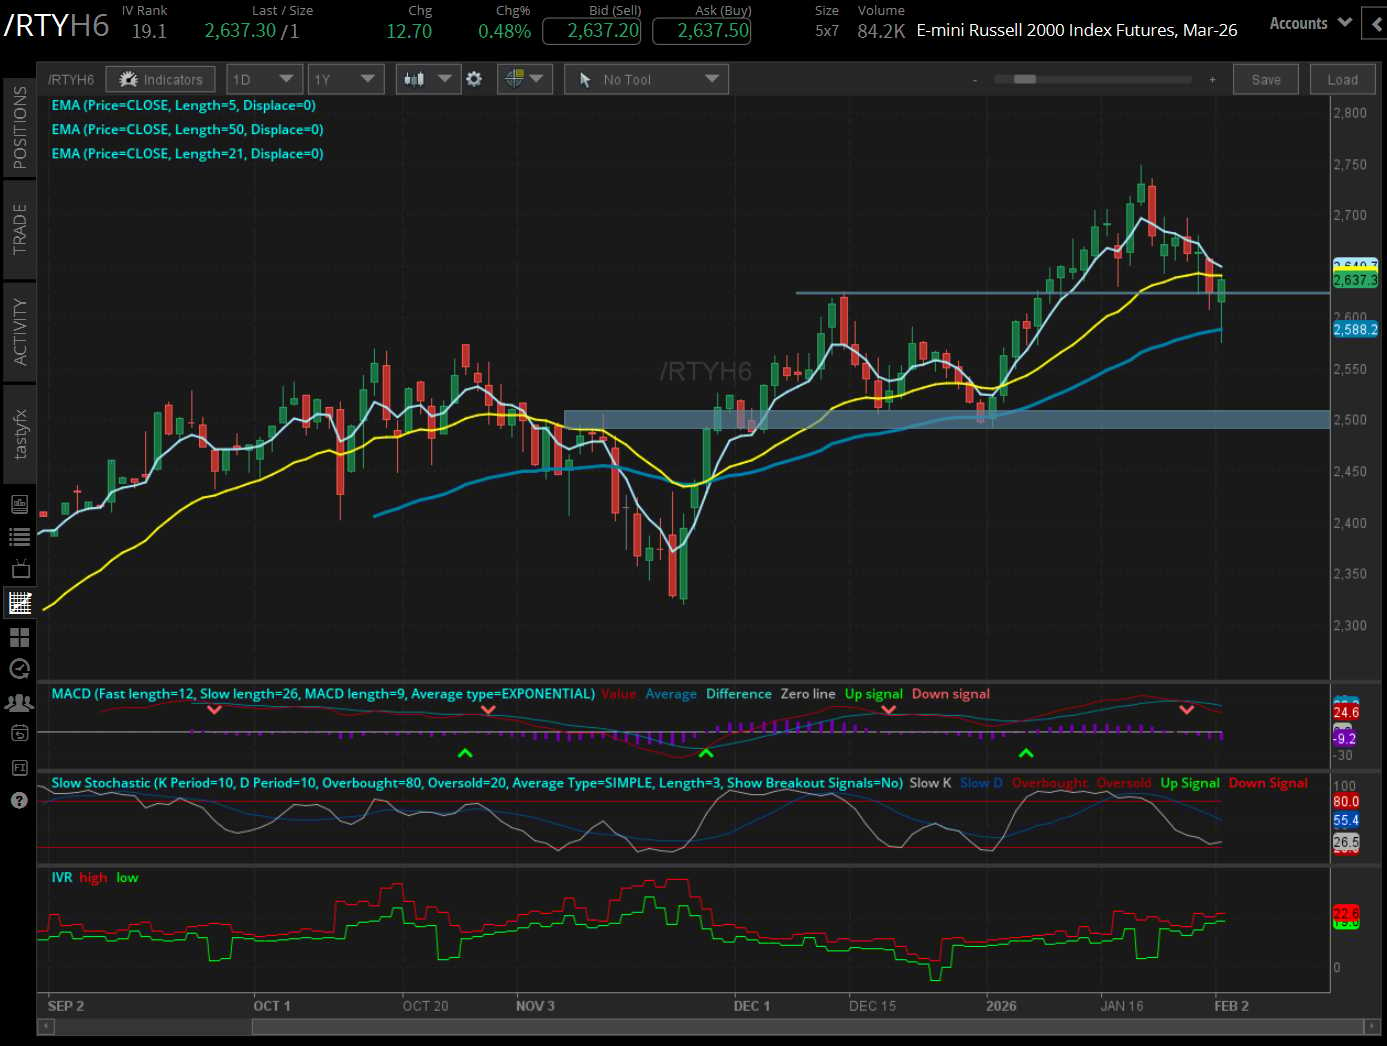
| Strategy: (46DTE, ATM) | Strikes | POP | Max Profit | Max Loss |
| Iron Condor | Long 2400 p Short 2450 p Short 2850 c Long 2900 c | 64% | +640 | -1860 |
| Short Strangle | Short 2450 p Short 2850 c | 69% | +1962.50 | x |
| Short Put Vertical | Long 2400 p Short 2450 p | 85% | +280 | -2200 |
Christopher Vecchio, CFA, tastylive’s head of futures and forex, has been trading for nearly 20 years. He has consulted with multinational firms on FX hedging and lectured at Duke Law School on FX derivatives. Vecchio searches for high-convexity opportunities at the crossroads of macroeconomics and global politics. He hosts Futures Power Hour Monday-Friday and Let Me Explain on Tuesdays, and co-hosts Overtime, Monday-Thursday. @cvecchiofx
Options involve risk and are not suitable for all investors. Please read Characteristics and Risks of Standardized Options before deciding to invest in options.
tastylive content is created, produced, and provided solely by tastylive, Inc. (“tastylive”) and is for informational and educational purposes only. It is not, nor is it intended to be, trading or investment advice or a recommendation that any security, futures contract, digital asset, other product, transaction, or investment strategy is suitable for any person. Trading securities, futures products, and digital assets involve risk and may result in a loss greater than the original amount invested. tastylive, through its content, financial programming or otherwise, does not provide investment or financial advice or make investment recommendations. Investment information provided may not be appropriate for all investors and is provided without respect to individual investor financial sophistication, financial situation, investing time horizon or risk tolerance. tastylive is not in the business of transacting securities trades, nor does it direct client commodity accounts or give commodity trading advice tailored to any particular client’s situation or investment objectives. Supporting documentation for any claims (including claims made on behalf of options programs), comparisons, statistics, or other technical data, if applicable, will be supplied upon request. tastylive is not a licensed financial adviser, registered investment adviser, or a registered broker-dealer. Options, futures, and futures options are not suitable for all investors. Prior to trading securities, options, futures, or futures options, please read the applicable risk disclosures, including, but not limited to, the Characteristics and Risks of Standardized Options Disclosure and the Futures and Exchange-Traded Options Risk Disclosure found on tastytrade.com/disclosures.
tastytrade, Inc. ("tastytrade”) is a registered broker-dealer and member of FINRA, NFA, and SIPC. tastytrade was previously known as tastyworks, Inc. (“tastyworks”). tastytrade offers self-directed brokerage accounts to its customers. tastytrade does not give financial or trading advice, nor does it make investment recommendations. You alone are responsible for making your investment and trading decisions and for evaluating the merits and risks associated with the use of tastytrade’s systems, services or products. tastytrade is a wholly-owned subsidiary of tastylive, Inc.
tastytrade has entered into a Marketing Agreement with tastylive (“Marketing Agent”) whereby tastytrade pays compensation to Marketing Agent to recommend tastytrade’s brokerage services. The existence of this Marketing Agreement should not be deemed as an endorsement or recommendation of Marketing Agent by tastytrade. tastytrade and Marketing Agent are separate entities with their own products and services. tastylive is the parent company of tastytrade.
tastyfx, LLC (“tastyfx”) is a Commodity Futures Trading Commission (“CFTC”) registered Retail Foreign Exchange Dealer (RFED) and Introducing Broker (IB) and Forex Dealer Member (FDM) of the National Futures Association (“NFA”) (NFA ID 0509630). Leveraged trading in foreign currency or off-exchange products on margin carries significant risk and may not be suitable for all investors. We advise you to carefully consider whether trading is appropriate for you based on your personal circumstances as you may lose more than you invest.
tastycrypto is provided solely by tasty Software Solutions, LLC. tasty Software Solutions, LLC is a separate but affiliate company of tastylive, Inc. Neither tastylive nor any of its affiliates are responsible for the products or services provided by tasty Software Solutions, LLC. Cryptocurrency trading is not suitable for all investors due to the number of risks involved. The value of any cryptocurrency, including digital assets pegged to fiat currency, commodities, or any other asset, may go to zero.
© copyright 2013 - 2026 tastylive, Inc. All Rights Reserved. Applicable portions of the Terms of Use on tastylive.com apply. Reproduction, adaptation, distribution, public display, exhibition for profit, or storage in any electronic storage media in whole or in part is prohibited under penalty of law, provided that you may download tastylive’s podcasts as necessary to view for personal use. tastylive was previously known as tastytrade, Inc. tastylive is a trademark/servicemark owned by tastylive, Inc.
Your privacy choices