Implied Volatility Explained: IV, HV, and IV Rank in Options Trading

Implied Volatility Explained: IV, HV, and IV Rank in Options Trading
Two volatility tools, one mission—identifying high-probability options trades
Implied volatility (IV) is a critical metric in the options market, reflecting the market’s expectations for future price movement and giving traders a forward-looking gauge of whether options are priced for calm or chaos.
Closely related to implied volatility are historical volatility—which shows how much the market has actually moved—and implied volatility rank (IV Rank), which puts implied volatility in context by ranking it within its one-year range.
These metrics provide market insight and a clear framework for interpreting implied volatility, giving traders the ability to turn raw market data into actionable trading ideas.
Volatility is one of the most powerful—and misunderstood—forces in options trading. Rather than focusing solely on predicting direction, volatility gives traders another way to view the market: it measures how much movement is being priced in, regardless of which way prices might go.
A solid grasp of volatility gives traders crucial context. When volatility is high, option prices tend to be expensive; when it’s low, they’re usually cheaper. Two simple checks help: compare implied volatility (IV)—the market’s forecast of future movement—with historical volatility (HV), which shows how much the market has actually moved. Then use implied volatility rank (IV Rank) to see where today’s IV sits within its one-year range, a quick read on whether current option prices are relatively high or low.
Today, we break down both approaches and show how they can help traders filter potential opportunities while also adding more structure to the decision-making process.
Turning Implied Volatility into Market Insight
At its core, implied volatility (IV) represents the market’s collective estimate of how much a stock or index might move—up or down—over a set period of time. When IV is high, it usually signals that traders are pricing in the potential for larger, more frequent price swings. When IV is low, it usually indicates expectations for a quieter, more stable market environment.
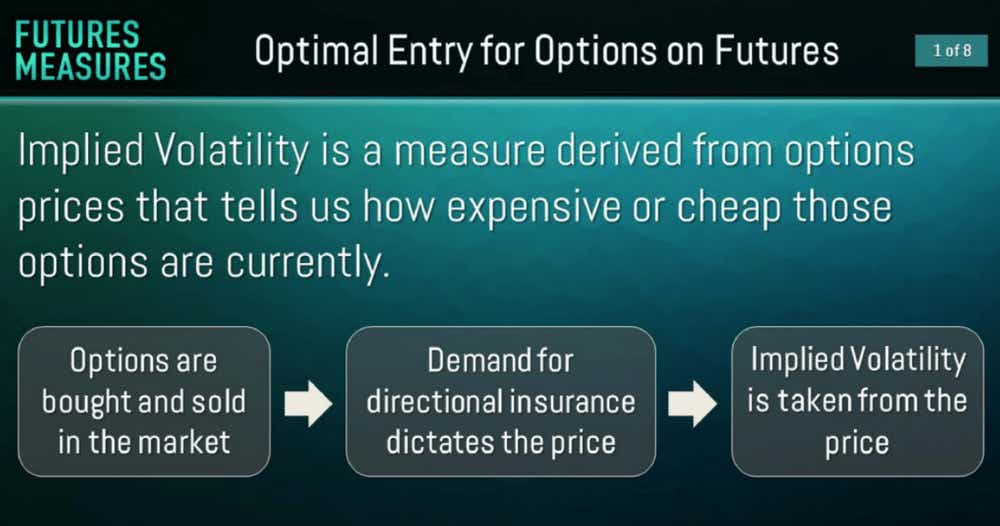
Here’s what makes IV so interesting: it isn’t plucked from thin air or guessed by some analyst—it’s derived from real-time option prices. Every time buyers and sellers agree on the price of an option, they’re essentially voting on how volatile they think the underlying will be. The result is a constantly updated snapshot of the market’s expectations.
Of course, just because the market “expects” something doesn’t mean it will happen. Implied volatility isn’t a perfect predictor—it’s more like a blend of science and art, a consensus that reflects both hard data and trader sentiment. Sometimes the market overestimates how wild things will get, sometimes it underestimates—but either way, implied volatility provides options market participants with a starting point for gauging whether options look relatively cheap or expensive.
Another key aspect of volatility is that it tends to revert toward its mean over time. Just as markets swing between periods of fear and complacency, IV tends to drift back toward its historical average—a behavior traders refer to as “mean reversion.” This tendency is what makes IV such a powerful signal for options traders. When IV is elevated, traders may sell premium, expecting option prices to contract as volatility cools off and drifts lower. When IV is low, some shift to buying premium—anticipating that volatility will eventually pick back up and push option prices higher (back toward the historical mean).
Volatility’s mean-reverting behavior is what makes it strategically appealing: it turns the market’s expectations into actionable signals. The aim isn’t to predict the next move, but instead to use volatility as a guide—leaning against extremes and deploying strategies that benefit as volatility trends back toward its long-term average.
Screening for Trading Ideas Using Historical Volatility
If implied volatility is the market’s best guess about the future, historical volatility (also called realized volatility) is the hard data about the past. It measures how much a stock, ETF, or index has actually moved over a chosen time frame. In other words, historical volatility is a factual record of what did happen, not what might happen.
For traders, this backward-looking measure is surprisingly useful. Comparing historical volatility to current implied volatility can uncover opportunities in the market. For example, if a stock has been swinging wildly (high historical volatility) but the options market is pricing in a tame future (low implied volatility), that may signal that the options are underpriced—a potential buying opportunity for traders looking to go long volatility. Conversely, if the past has been quiet, but implied volatility is unusually high, it may suggest options are expensive and ripe for selling.
Of course, there are no guarantees. Sometimes it can take longer than expected for implied volatility to trend back toward its mean. And in the meantime, it might move in an unpredictable manner. As a result, traders still need to consider why there’s a mismatch. Maybe the company just exited an unusually volatile period, and the calm is real—or maybe the market is underestimating risk ahead of an upcoming catalyst.
The key is to pair volatility data with the qualitative narrative: earnings reports, economic releases, sector trends, or macro events that could justify higher or lower volatility expectations. That’s where skill and judgment transform volatility metrics into tradable edge.
Looking at a hypothetical example, imagine a stock that’s been trading with 40% historical volatility over the past month, yet its options are pricing in only 32% implied volatility for the future. That gap suggests the market expects price swings to settle down. But if you believe the story isn’t finished—perhaps earnings are coming up or a key regulatory decision is around the corner—you might lean toward strategies that benefit from rising implied volatility. On the flip side, if implied volatility is well above what history suggests, traders might look to sell premium, aiming to profit if volatility drifts lower.
IV Rank: Another Tool for Identifying Market Opportunities
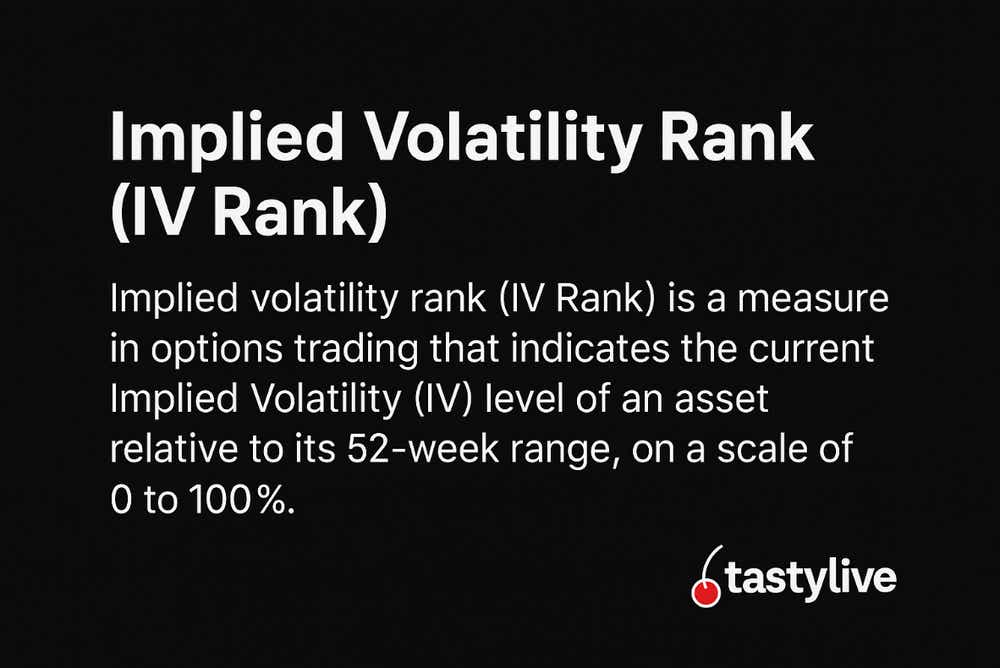
While implied volatility gives us the market’s raw forecast for future movement, implied volatility rank (IV Rank or IVR) adds valuable context by telling us where today’s implied volatility sits relative to its own history. IV Rank is scored from 0 to 100, where 0 represents the lowest IV level seen over the past year and 100 represents the highest. So, if a stock’s implied volatility has ranged from 30% to 60% over the last 52 weeks and is currently 45%, its IV Rank would be 50—smack in the middle of its yearly range.
And that's where things get actionable. Traders often lean on the mean-reverting nature of volatility: when IV Rank is elevated (say, above 60), they might look for opportunities to sell options and collect premium, with the expectation that volatility will eventually drift lower. When IV Rank is depressed (below 40, or even below 20–30 in a low-volatility market), some traders look for strategies that benefit from rising implied volatility, like long straddles or debit spreads. IV Rank doesn’t tell you which direction the underlying will move—but it can help you decide whether you want to be a net buyer or seller of options given current pricing.
As always, context is king. Just because a stock’s IV Rank is high doesn’t necessarily make it a good candidate for selling premium—there might be a legitimate reason why the market is pricing in elevated volatility (an earnings announcement, regulatory news, or macro catalyst). Likewise, a low IV Rank doesn’t guarantee an upcoming volatility pop—sometimes quiet markets stay quiet. The key is to combine IV Rank with your broader outlook, so you’re trading volatility with intention, rather than just reacting to a number.
Looking at another hypothetical example, imagine TSTY has seen implied volatility range from 20% to 60% over the past year, and today it’s sitting at 55%—giving it an IV Rank of about 87. That’s a clear signal that options are near the top of their one-year price range. If you don’t see an upcoming event that justifies such expensive premiums, you might elect to deploy a short premium strategy—like a short straddle or strangle—to take advantage of the rich option prices, and the potential for implied volatility to drift back toward its historical average.
Implied Volatility Takeaways
Options trading doesn’t have to be purely directional. Many traders rely on volatility metrics—like implied volatility and IV Rank—to gauge whether options appear rich, cheap, or fairly valued. These tools put today’s market expectations in context, comparing them to what actually happened and where current levels sit relative to recent history.
Together, these metrics form a repeatable framework for finding high-probability setups. While the goal is often to profit from mean reversion, the most effective traders pair the numbers with the narrative—earnings dates, company catalysts, and macro events—so positions reflect the full market picture, including the risks.
To learn more about these volatility metrics, check out the tastylive resources highlighted below:
Andrew Prochnow has traded the global financial markets for more than 15 years, including 10 years as a professional options trader.
For live daily programming, market news and commentary, visit tastylive or the YouTube channels tastylive (for options traders), and tastyliveTrending for stocks, futures, forex & macro.
Trade with a better broker, open a tastytrade account today. tastylive, Inc. and tastytrade, Inc. are separate but affiliated companies.
Options involve risk and are not suitable for all investors. Please read Characteristics and Risks of Standardized Options before deciding to invest in options.
tastylive content is created, produced, and provided solely by tastylive, Inc. (“tastylive”) and is for informational and educational purposes only. It is not, nor is it intended to be, trading or investment advice or a recommendation that any security, futures contract, digital asset, other product, transaction, or investment strategy is suitable for any person. Trading securities, futures products, and digital assets involve risk and may result in a loss greater than the original amount invested. tastylive, through its content, financial programming or otherwise, does not provide investment or financial advice or make investment recommendations. Investment information provided may not be appropriate for all investors and is provided without respect to individual investor financial sophistication, financial situation, investing time horizon or risk tolerance. tastylive is not in the business of transacting securities trades, nor does it direct client commodity accounts or give commodity trading advice tailored to any particular client’s situation or investment objectives. Supporting documentation for any claims (including claims made on behalf of options programs), comparisons, statistics, or other technical data, if applicable, will be supplied upon request. tastylive is not a licensed financial adviser, registered investment adviser, or a registered broker-dealer. Options, futures, and futures options are not suitable for all investors. Prior to trading securities, options, futures, or futures options, please read the applicable risk disclosures, including, but not limited to, the Characteristics and Risks of Standardized Options Disclosure and the Futures and Exchange-Traded Options Risk Disclosure found on tastytrade.com/disclosures.
tastytrade, Inc. ("tastytrade”) is a registered broker-dealer and member of FINRA, NFA, and SIPC. tastytrade was previously known as tastyworks, Inc. (“tastyworks”). tastytrade offers self-directed brokerage accounts to its customers. tastytrade does not give financial or trading advice, nor does it make investment recommendations. You alone are responsible for making your investment and trading decisions and for evaluating the merits and risks associated with the use of tastytrade’s systems, services or products. tastytrade is a wholly-owned subsidiary of tastylive, Inc.
tastytrade has entered into a Marketing Agreement with tastylive (“Marketing Agent”) whereby tastytrade pays compensation to Marketing Agent to recommend tastytrade’s brokerage services. The existence of this Marketing Agreement should not be deemed as an endorsement or recommendation of Marketing Agent by tastytrade. tastytrade and Marketing Agent are separate entities with their own products and services. tastylive is the parent company of tastytrade.
tastyfx, LLC (“tastyfx”) is a Commodity Futures Trading Commission (“CFTC”) registered Retail Foreign Exchange Dealer (RFED) and Introducing Broker (IB) and Forex Dealer Member (FDM) of the National Futures Association (“NFA”) (NFA ID 0509630). Leveraged trading in foreign currency or off-exchange products on margin carries significant risk and may not be suitable for all investors. We advise you to carefully consider whether trading is appropriate for you based on your personal circumstances as you may lose more than you invest.
tastycrypto is provided solely by tasty Software Solutions, LLC. tasty Software Solutions, LLC is a separate but affiliate company of tastylive, Inc. Neither tastylive nor any of its affiliates are responsible for the products or services provided by tasty Software Solutions, LLC. Cryptocurrency trading is not suitable for all investors due to the number of risks involved. The value of any cryptocurrency, including digital assets pegged to fiat currency, commodities, or any other asset, may go to zero.
© copyright 2013 - 2026 tastylive, Inc. All Rights Reserved. Applicable portions of the Terms of Use on tastylive.com apply. Reproduction, adaptation, distribution, public display, exhibition for profit, or storage in any electronic storage media in whole or in part is prohibited under penalty of law, provided that you may download tastylive’s podcasts as necessary to view for personal use. tastylive was previously known as tastytrade, Inc. tastylive is a trademark/servicemark owned by tastylive, Inc.
Your privacy choices