Filter
What Is Implied Volatility (IV) Rank and How to Use It in Options Trading?
What Is Implied Volatility (IV) Rank?
Implied volatility rank (aka IV rank or IVR) is a statistic/measurement used when trading options, and reports how the current level of implied volatility in a given underlying compares to the last 52 weeks of historical data. IVR is on a scale between 0-100, where 0 represents the low IV% print for the year, and 100 represents the high IV% print.
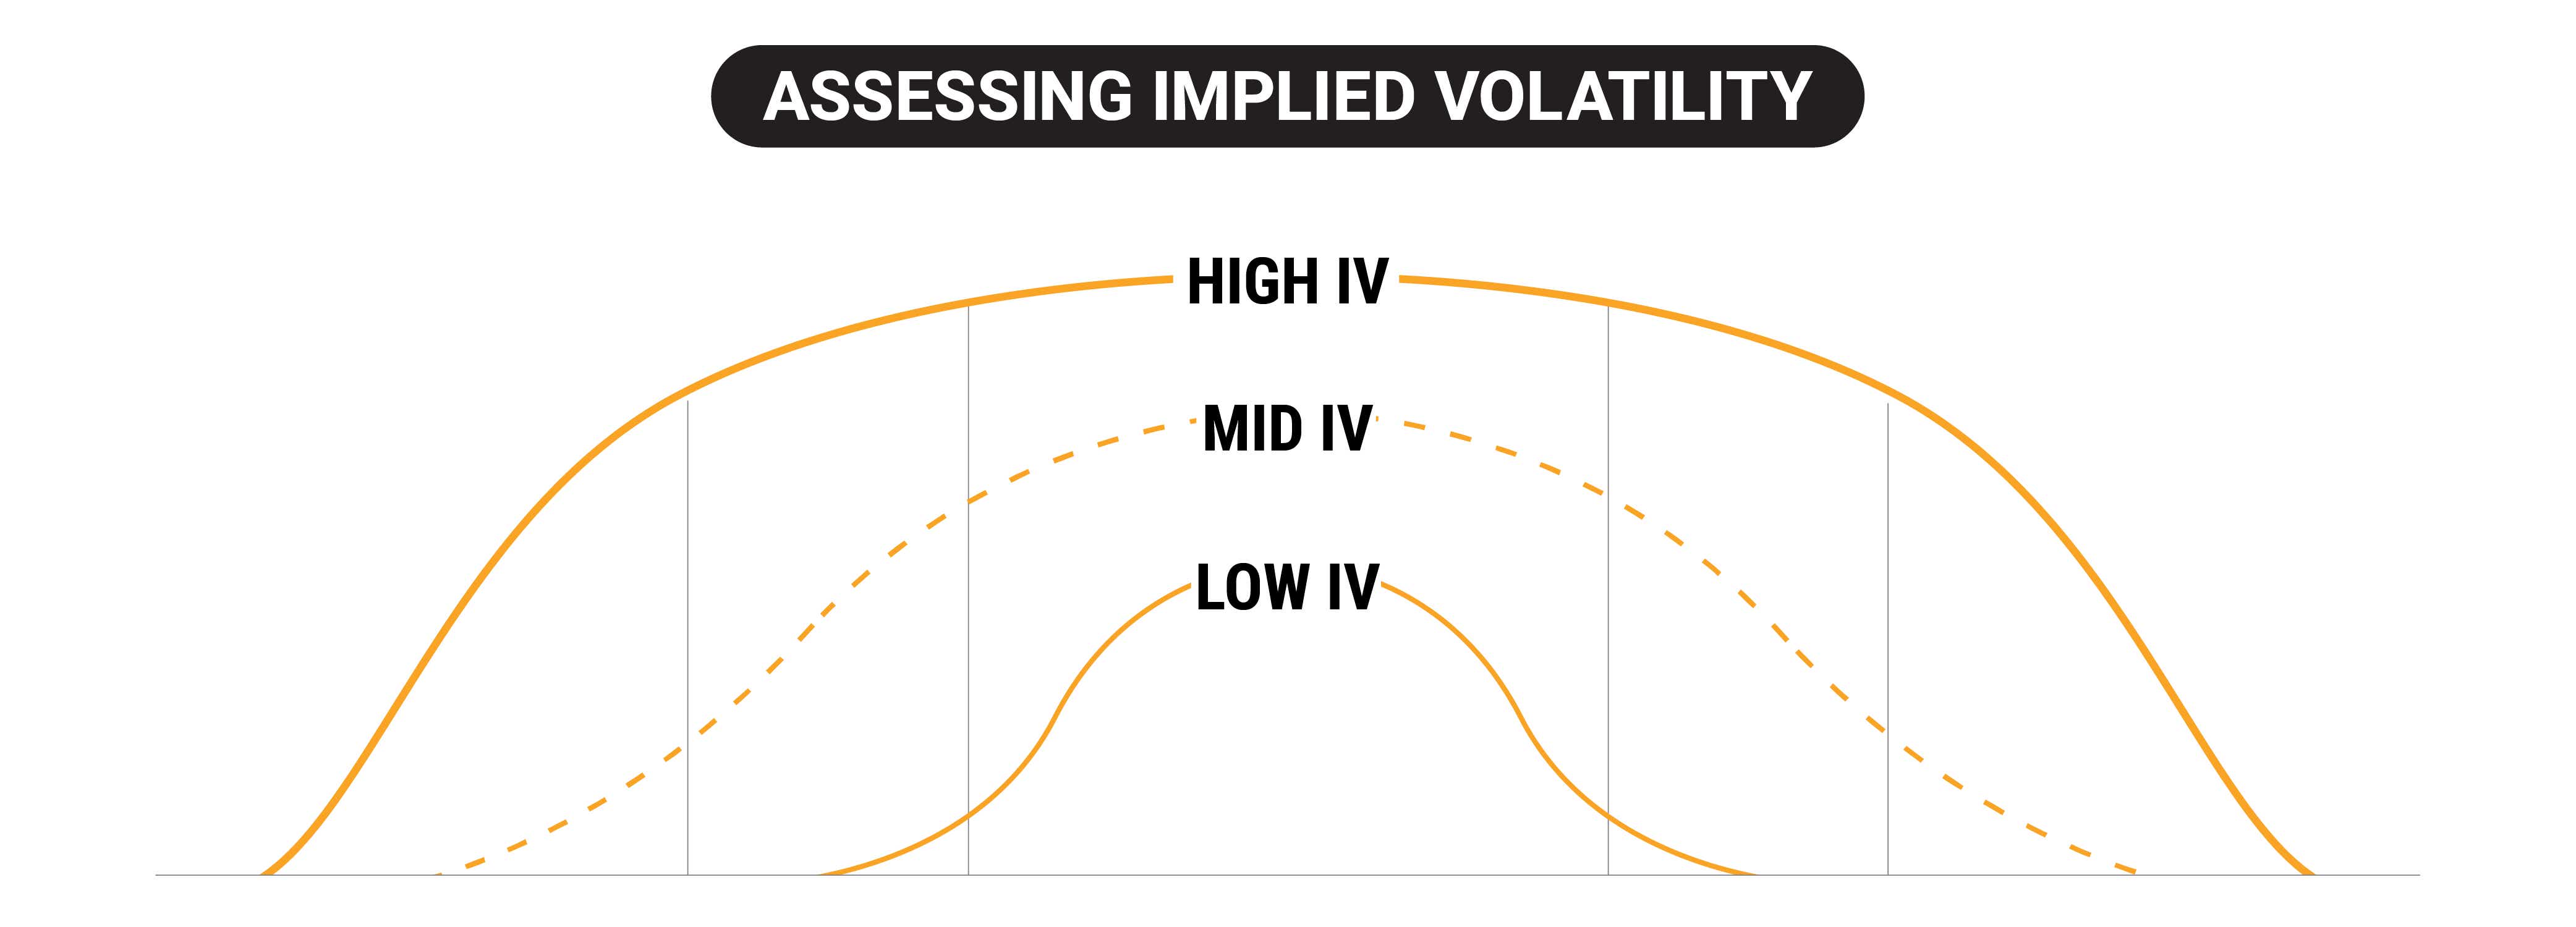
Option traders typically use implied volatility rank to assess whether implied volatility (IV) is high or low in a specific underlying based on the past year of implied volatility data. High levels of implied volatility may signal that an opportunity exists to sell options/volatility, while extremely low levels of implied volatility may signal that an opportunity exists to buy options/volatility.
IV Rank Example
For example, if implied volatility ranged between 30% and 60% during the last 52 weeks in hypothetical stock XYZ, and implied volatility is currently trading at 45%, XYZ would have an implied volatility rank of 50.
If implied volatility were currently trading 60% in XYZ stock, then the associated implied volatility rank would be 100—indicating that implied volatility in XYZ was trading at the highest levels observed in the last 52 weeks. If implied volatility goes above 60%, then the current IV would be setting the new upper bound for IV rank going forward.
What is Implied Volatility?
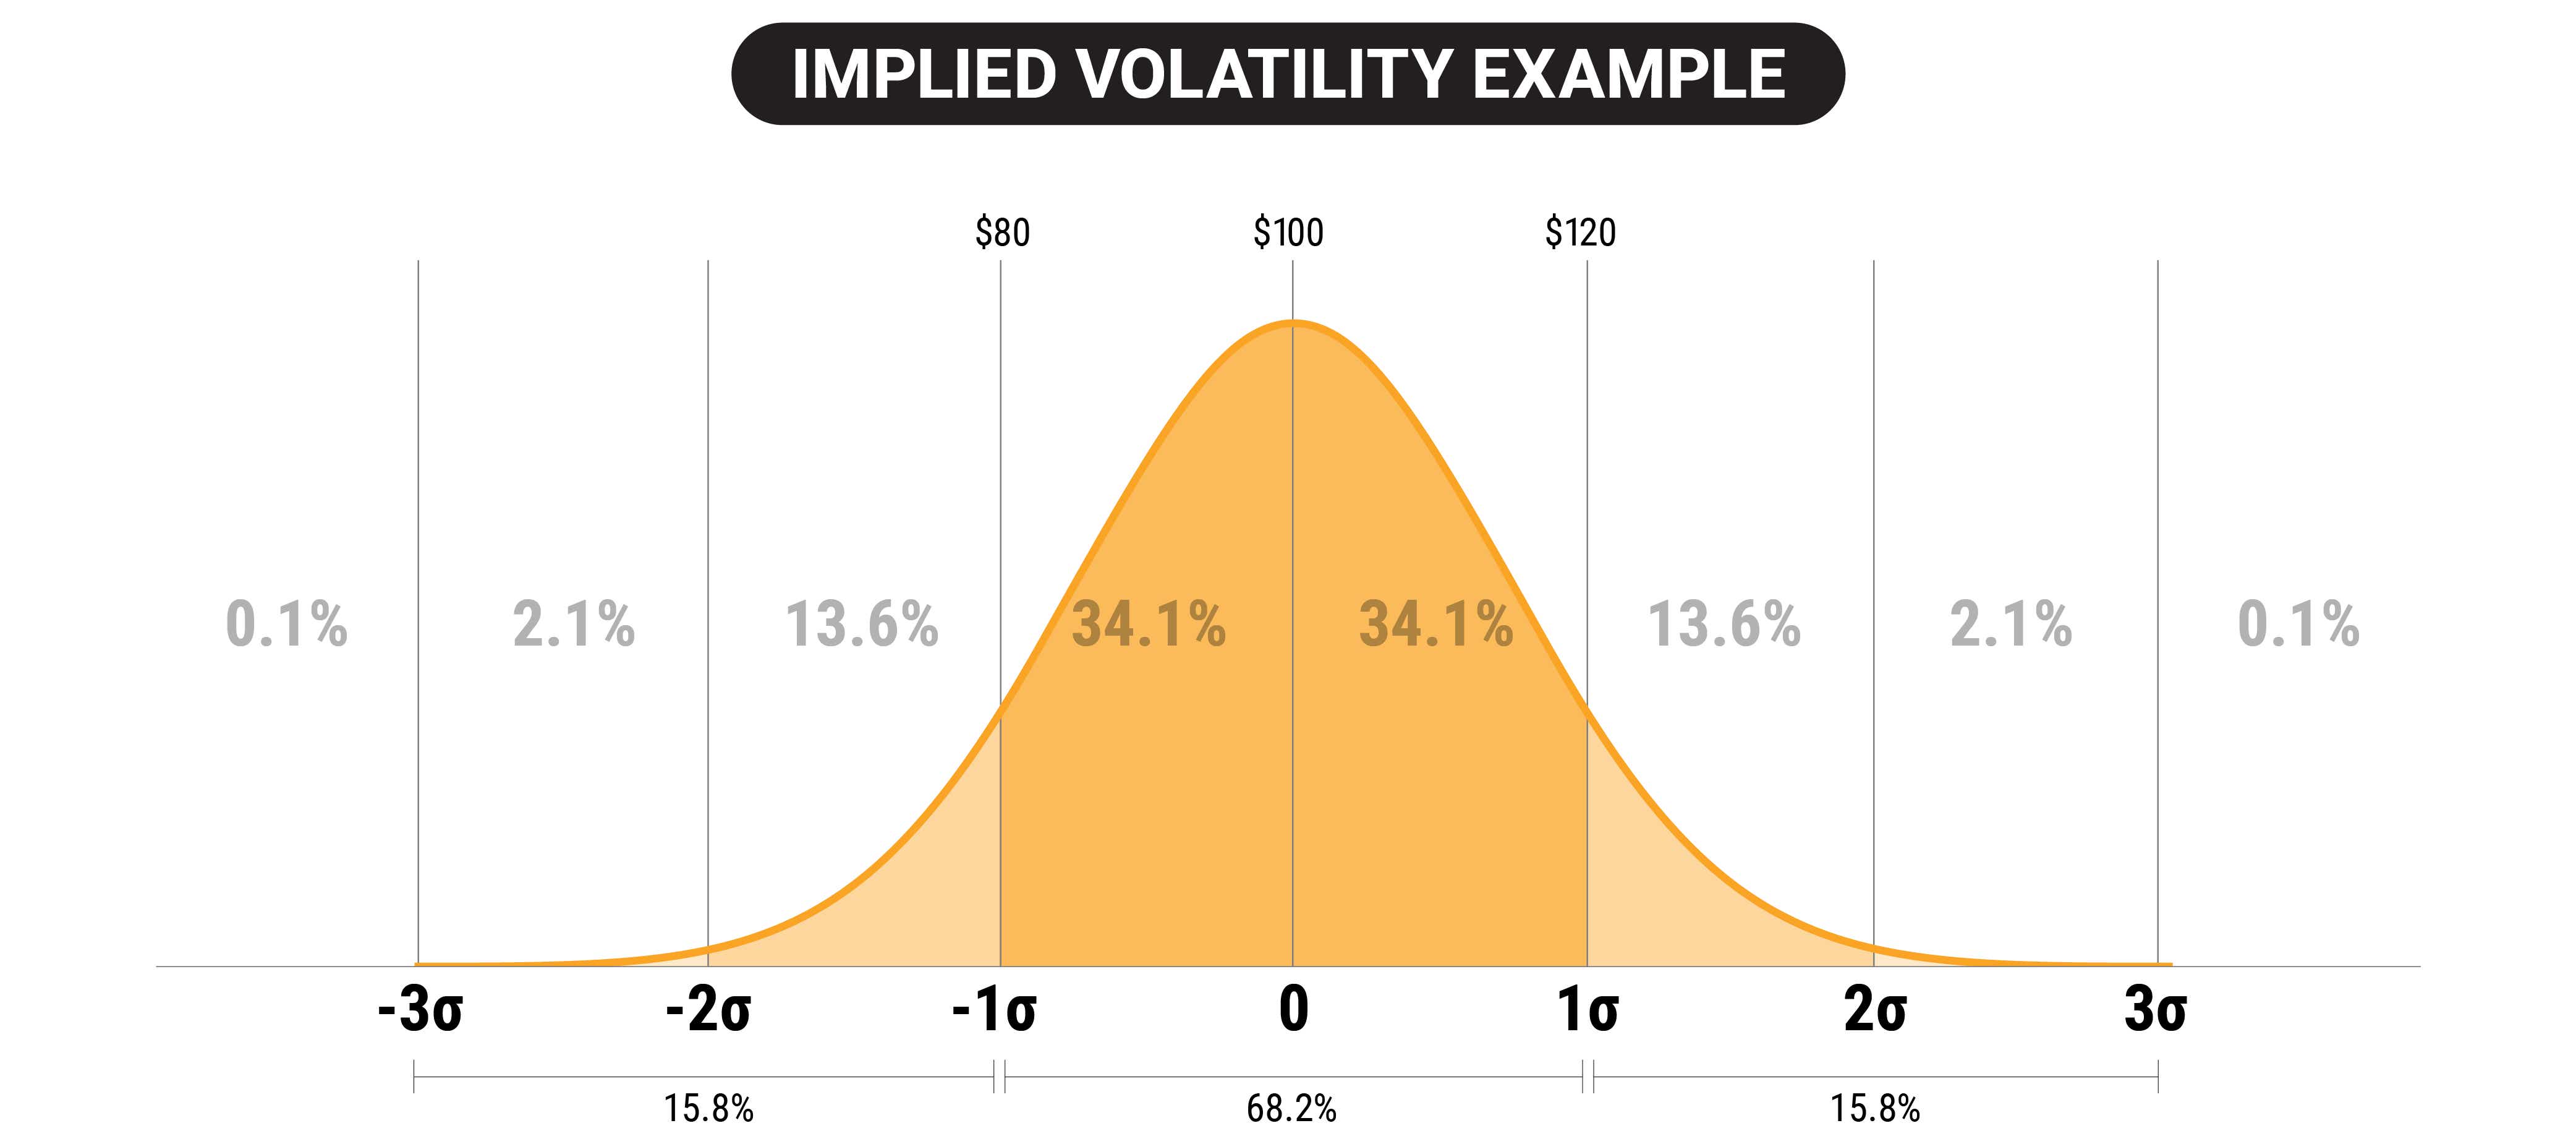
Implied volatility is the projected annual price movement of an underlying stock, presented on a one standard deviation (SD) basis. This figure is derived from the options prices - in other words, we use the Black-Scholes model’s inputs to solve for IV, not the other way around.
If XYZ stock is trading at $100 per share and has an implied volatility of 20%, that means the projected price movement for the stock is between $80-120 over the course of the year. Remember, this is presented on a one standard deviation basis, which accounts for 68.2% of occurrences.
IV is not perfect for that reason, but it does allow us to use options prices to determine how much future stock price volatility we may expect. The higher the IV number, the more projected movement we should expect as options prices are more expensive than a low IV environment.
How to Calculate Implied Volatility (IV) Rank?
What Is Implied Volatility Percentile?
Implied volatility percentile (aka IV percentile or IVP) is another important metric that market participants can use to analyze the relative extrinsic value of an option. Similar to implied volatility rank, implied volatility percentile provides insight into the current level of implied volatility as compared to the last 52 weeks of data.
However, in the case of implied volatility percentile, the metric reports the percentage of days over the last 52 weeks that implied volatility traded below the current level of implied volatility.
For example, if implied volatility percentile is 5% in hypothetical underlying XYZ, that would indicate that implied volatility only traded below current levels 5% of the time over the course of the previous 52 weeks. That reading would suggest that implied volatility is currently closer to the lower end of its historical range, because 95% of the time implied volatility is higher than it is now.
On the other hand, if IV percentile in XYZ is 90%, that would indicate that implied volatility had traded below current levels 90% of the time over the previous 52 weeks. That level would therefore indicate that implied volatility was trading at the higher end of its historical range.
Much like IV rank, market participants can use IV percentile to assess how current levels of implied volatility compare to the previous 52 weeks of historical data.
How to Calculate Implied Volatility (IV) Percentile?
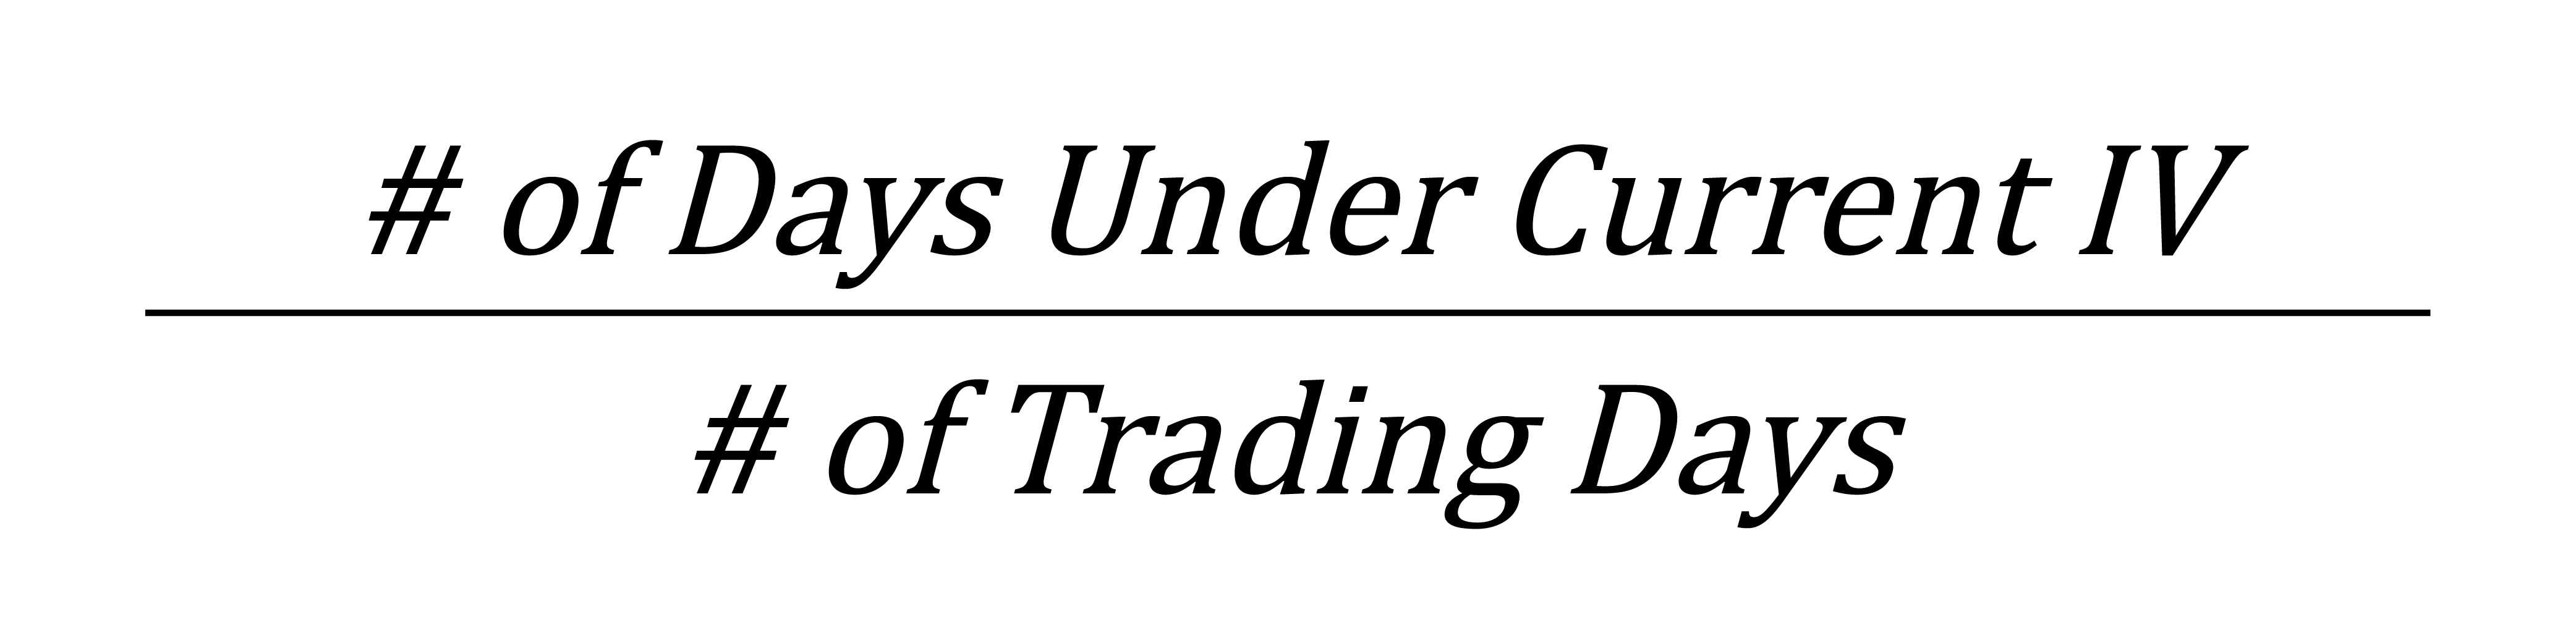
IV percentile is a very simple calculation, but you need the IV% data for every trading day to determine how the current IV% weighs against the previous 252 trading days of the year.
Once you have these values, you simply divide the number of days previous IV% was below the current IV% by 252 trading days.
How Do You Use IV Rank and IV Percentile?
While other considerations may be taken into account, an implied volatility rank above 50% can be indicative of an attractive opportunity to sell options/volatility, while an implied volatility rank well below 50% can be indicative of an attractive opportunity to buy options/volatility—both due to the mean reverting nature of implied volatility.
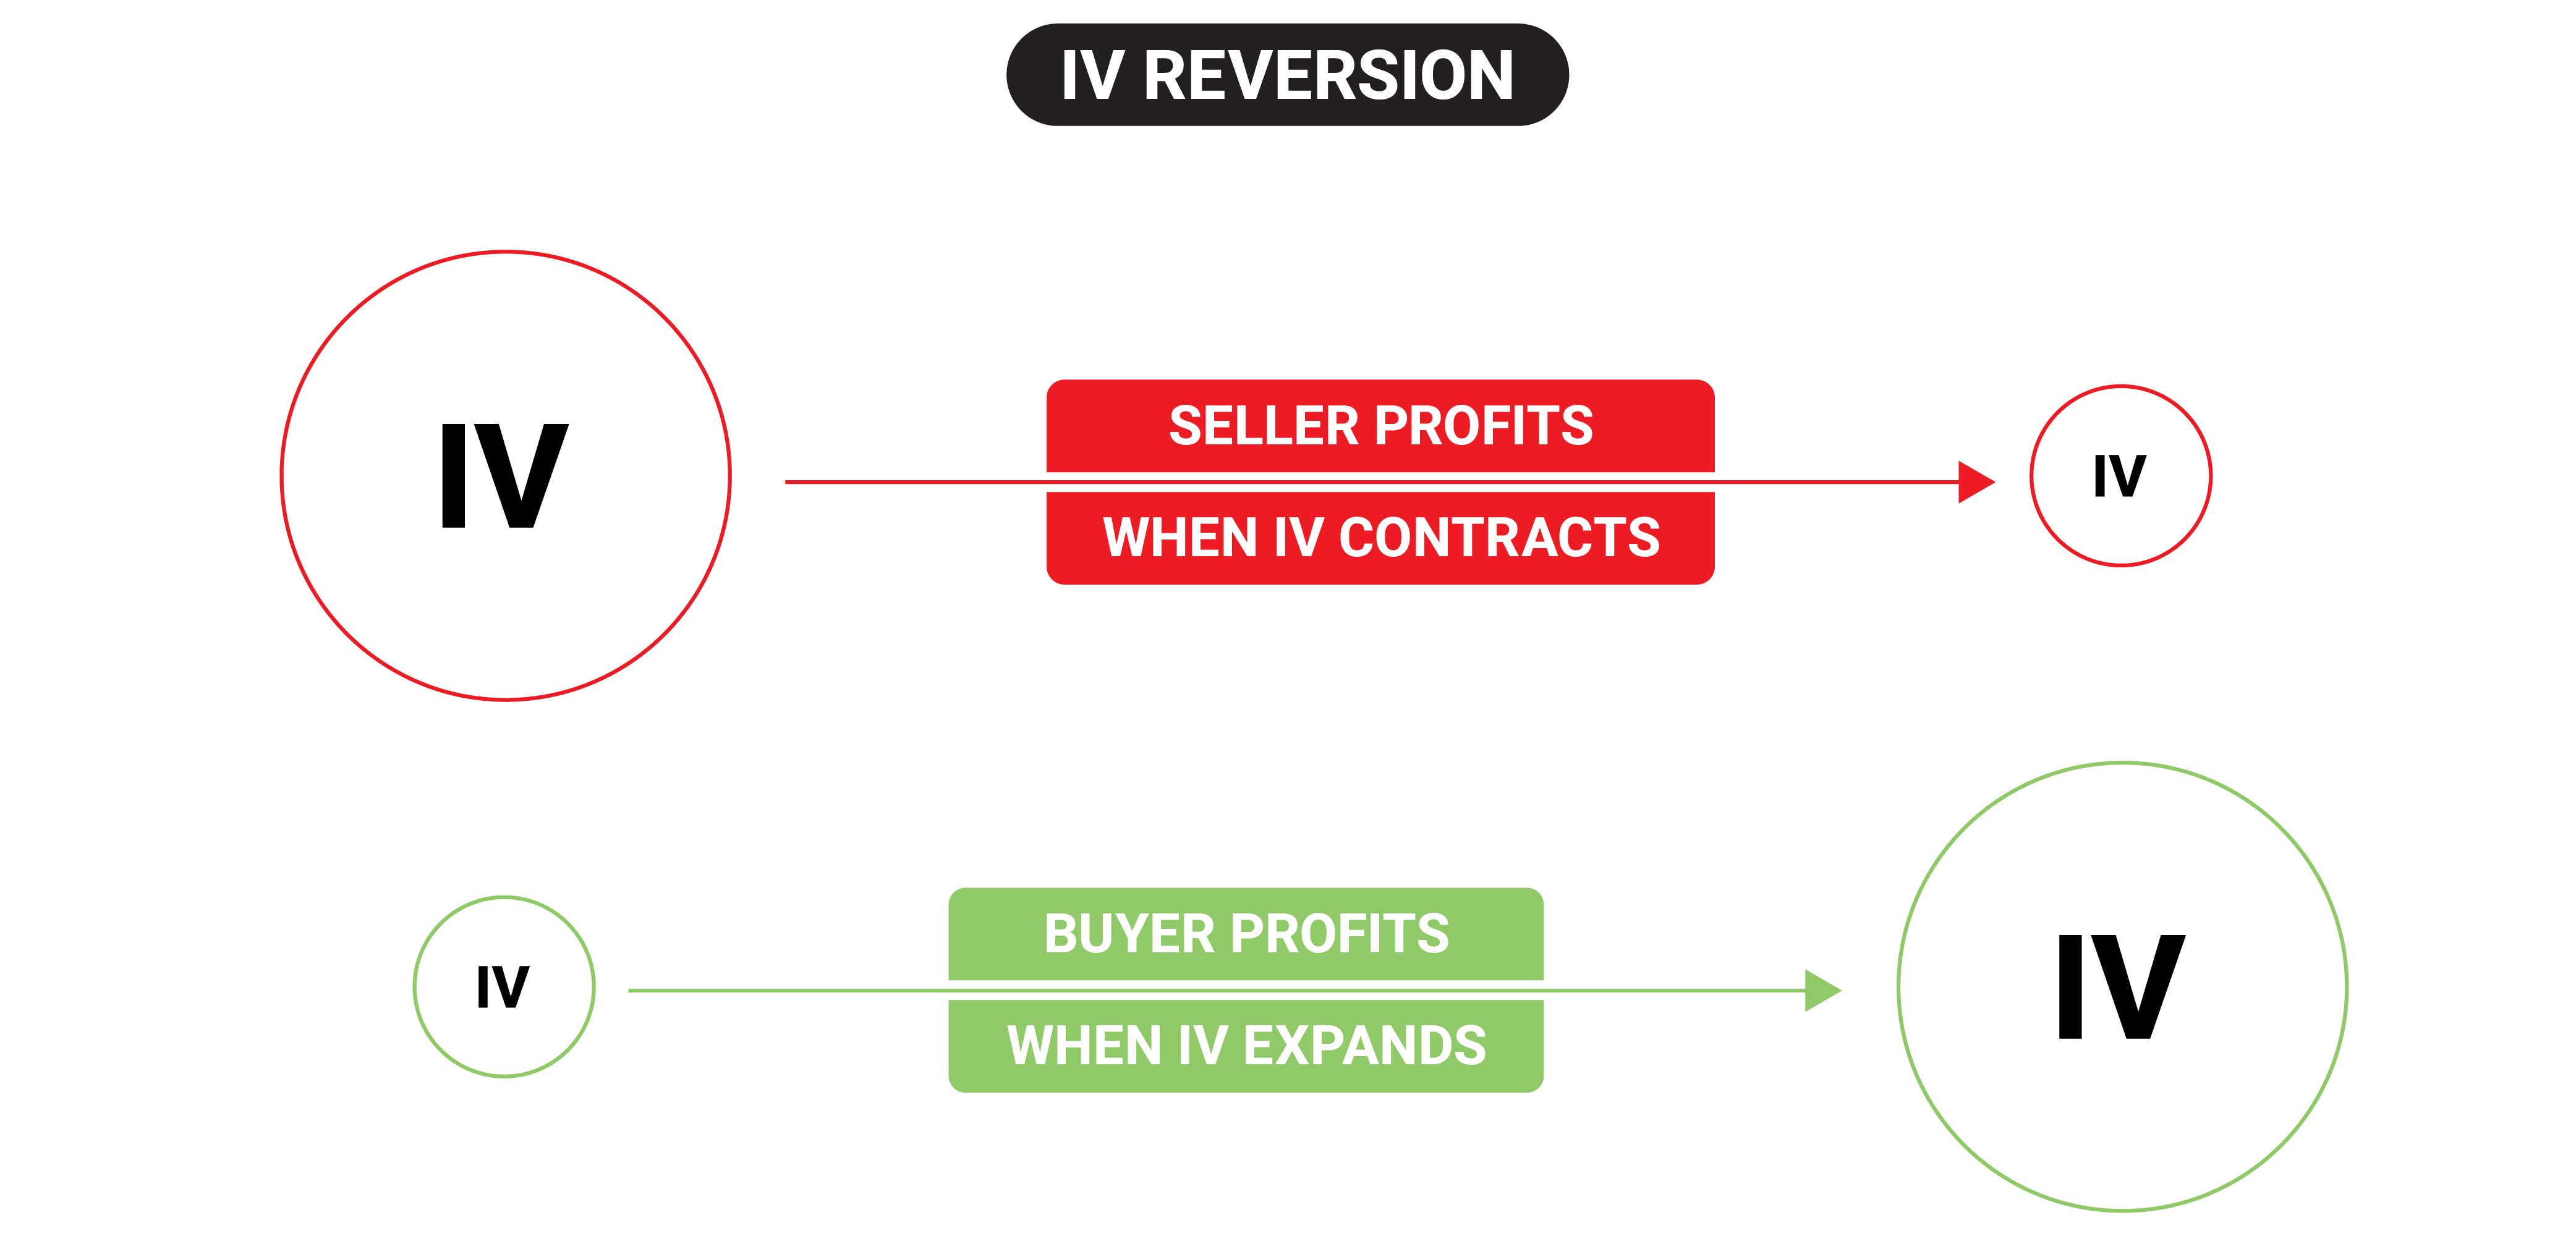
Profit in mean reversion trades is by no means guaranteed, because future volatility is unknown. However, it has been observed that implied volatility is mean reverting on average, over time.
Much like IV rank, market participants can use IV percentile to assess how current levels of implied volatility compare to the previous 52 weeks of historical data.
For example, if implied volatility percentile is 5% in hypothetical underlying XYZ, that would indicate that implied volatility only traded below current levels 5% of the time over the course of the previous 52 weeks.
That reading would suggest that implied volatility is currently closer to the lower end of its historical range, because 95% of the time implied volatility was higher than it is now. When implied volatility percentile is between 0-30% that may be an indicator that options/volatility are “cheap,” and attractive to buy.
The reverse is true for elevated implied volatility percentiles at 70% or above, because an elevated IV percentile indicates that implied volatility is at the higher end of its historical range.
For example, if implied volatility percentile is 90%, that means implied volatility traded below current levels 90% of total trading days over the course of the previous 52 weeks, and that implied volatility was higher than the current level only 10% of the total trading days over the last 52 weeks.
At the end of the day, IVR and IVP are contextual metrics to determine if extrinsic value in options prices are high or low, and traders use that information to determine strategy selection, desired risk, etc.
IV Rank and IV Percentile Summed Up
- Implied volatility rank (aka IV rank or IVR) is a statistic/measurement used when trading options, and reports how the current level of implied volatility in a given underlying compares to the last 52 weeks of historical data.
- That means if implied volatility ranged between 30% and 60% during the last 52 weeks in hypothetical stock XYZ, and implied volatility is currently trading at 45%, XYZ would have an implied volatility rank of 50.
- Similar to implied volatility rank, implied volatility percentile (aka IV percentile or IVP) provides insight into the current level of implied volatility as compared to the last 52 weeks of data.
- Implied volatility percentile reports the percentage of days over the last 52 weeks that implied volatility traded below the current level of implied volatility.
- Market participants can use both IV rank and IV percentile in conjunction with each other to assess the current level of implied volatility in a given underlying as compared to the last 52 weeks of data.
- Generally speaking, market participants often view elevated levels of IV rank and IV percentile as relatively attractive for selling options/volatility, while depressed levels of IV rank and IV percentile are viewed as more attractive for buying options/volatility.
FAQs
What Is Implied Volatility (IV) Rank?
Implied volatility rank (aka IV rank or IVR) is a statistic/measurement used when trading options, and reports how the current level of implied volatility in a given underlying compares to the last 52 weeks of historical data.
What is a High IV Rank?
If implied volatility ranged between 30% and 60% during the last 52 weeks in hypothetical stock XYZ, and implied volatility is currently trading at 45%, XYZ would have an implied volatility rank of 50.
If implied volatility were currently trading 60% in XYZ, then the associated implied volatility rank would be 100—indicating that implied volatility in XYZ was trading at the highest levels observed in the last 52 weeks.
Implied volatility rank is generally considered to be elevated (i.e. “high”) when it is greater than 50. Extreme levels in IV rank would be 80 and above.
Alternatively, when implied volatility rank is depressed (<20) that may be viewed as a potential opportunity to buy options/volatility.
IV Rank vs. IV Percentile: What’s the Difference?
While IV rank and IV percentile both use historical IV data to determine how high or low current IV% is, the calculations are slightly different and produce different results for that reason.
The main difference between IVR and IVP is the fact that IVR uses a range that moves as the high and low IV% points are hit - for example, if IV% is so high that it is creating a new upper bound for IV rank, that means the median value or IVR of 50 is now higher than what it was before.
IVP weighs each day instead, so the results are more smooth - a spike in IV% does not create a new upper bound for IVP, it would just count as one day in the calculation where current IV% was not below the historical IV%.
How Do You Determine IV Rank?
The calculation for IV rank is pretty simple, but you do need to know the high and low IV% points for the previous year. Once you find these values, you can measure where current IV stands against the high and low point of IV% to determine the IV rank.
![]()
If implied volatility ranged between 20% and 70% during the last 52 weeks in hypothetical stock XYZ, and implied volatility is currently trading at 60%, XYZ would have an implied volatility rank of 80%
Is IV Rank Good or Bad?
Implied volatility rank is a statistic/metric that reports how the current level of implied volatility in a given underlying compares to the last 52 weeks of historical data. In that regard, IV rank is neither “good” nor “bad.”
IV rank simply reports on whether current levels of implied volatility are high, low, or neutral (i.e. expensive, cheap, or fair), as compared to historical levels of implied volatility in a given underlying.
Options and volatility traders use IV rank to assess whether current levels of implied volatility are high (i.e. expensive) or low (i.e. cheap) and may decide to deploy an options/volatility trade based on IV rank, among other factors.
Generally speaking, short options/volatility trades become relatively more attractive when IV rank is above 50%, whereas long options/volatility trades become relatively more attractive when IV rank is below 50%.
However, due to the existence of time decay (aka theta decay), options traders often filter for even lower levels of IV rank (20% and below) when buying options due to the fact that options naturally lose value as time passes.
How Do You Use IV Rank and IV Percentile?
Traders use IVR and IVP to put context around current implied volatility levels. Low readings of IVR or IVP indicate that extrinsic value in options prices are low compared to a high IVR/IVP environment. This may lean traders towards defined risk strategies, or long option strategies.
In high IVR/IVP environments, options prices are deemed to be on the higher end of their previous range over the course of a year. This may lean traders towards short premium trades, or trades that benefit from an IV contraction.
Both metrics use 52 weeks of historical data, and weigh the current IV% against that historical data in slightly different ways.
Supplemental Content
Episodes on Implied Volatility
No episodes available at this time. Check back later!
tastylive content is created, produced, and provided solely by tastylive, Inc. (“tastylive”) and is for informational and educational purposes only. It is not, nor is it intended to be, trading or investment advice or a recommendation that any security, futures contract, digital asset, other product, transaction, or investment strategy is suitable for any person. Trading securities, futures products, and digital assets involve risk and may result in a loss greater than the original amount invested. tastylive, through its content, financial programming or otherwise, does not provide investment or financial advice or make investment recommendations. Investment information provided may not be appropriate for all investors and is provided without respect to individual investor financial sophistication, financial situation, investing time horizon or risk tolerance. tastylive is not in the business of transacting securities trades, nor does it direct client commodity accounts or give commodity trading advice tailored to any particular client’s situation or investment objectives. Supporting documentation for any claims (including claims made on behalf of options programs), comparisons, statistics, or other technical data, if applicable, will be supplied upon request. tastylive is not a licensed financial adviser, registered investment adviser, or a registered broker-dealer. Options, futures, and futures options are not suitable for all investors. Prior to trading securities, options, futures, or futures options, please read the applicable risk disclosures, including, but not limited to, the Characteristics and Risks of Standardized Options Disclosure and the Futures and Exchange-Traded Options Risk Disclosure found on tastytrade.com/disclosures.
tastytrade, Inc. ("tastytrade”) is a registered broker-dealer and member of FINRA, NFA, and SIPC. tastytrade was previously known as tastyworks, Inc. (“tastyworks”). tastytrade offers self-directed brokerage accounts to its customers. tastytrade does not give financial or trading advice, nor does it make investment recommendations. You alone are responsible for making your investment and trading decisions and for evaluating the merits and risks associated with the use of tastytrade’s systems, services or products. tastytrade is a wholly-owned subsidiary of tastylive, Inc.
tastytrade has entered into a Marketing Agreement with tastylive (“Marketing Agent”) whereby tastytrade pays compensation to Marketing Agent to recommend tastytrade’s brokerage services. The existence of this Marketing Agreement should not be deemed as an endorsement or recommendation of Marketing Agent by tastytrade. tastytrade and Marketing Agent are separate entities with their own products and services. tastylive is the parent company of tastytrade.
tastyfx, LLC (“tastyfx”) is a Commodity Futures Trading Commission (“CFTC”) registered Retail Foreign Exchange Dealer (RFED) and Introducing Broker (IB) and Forex Dealer Member (FDM) of the National Futures Association (“NFA”) (NFA ID 0509630). Leveraged trading in foreign currency or off-exchange products on margin carries significant risk and may not be suitable for all investors. We advise you to carefully consider whether trading is appropriate for you based on your personal circumstances as you may lose more than you invest.
tastycrypto is provided solely by tasty Software Solutions, LLC. tasty Software Solutions, LLC is a separate but affiliate company of tastylive, Inc. Neither tastylive nor any of its affiliates are responsible for the products or services provided by tasty Software Solutions, LLC. Cryptocurrency trading is not suitable for all investors due to the number of risks involved. The value of any cryptocurrency, including digital assets pegged to fiat currency, commodities, or any other asset, may go to zero.
© copyright 2013 - 2026 tastylive, Inc. All Rights Reserved. Applicable portions of the Terms of Use on tastylive.com apply. Reproduction, adaptation, distribution, public display, exhibition for profit, or storage in any electronic storage media in whole or in part is prohibited under penalty of law, provided that you may download tastylive’s podcasts as necessary to view for personal use. tastylive was previously known as tastytrade, Inc. tastylive is a trademark/servicemark owned by tastylive, Inc.
Your privacy choices