Filter
What is Volatility Skew and How to Trade it
What is volatility skew?
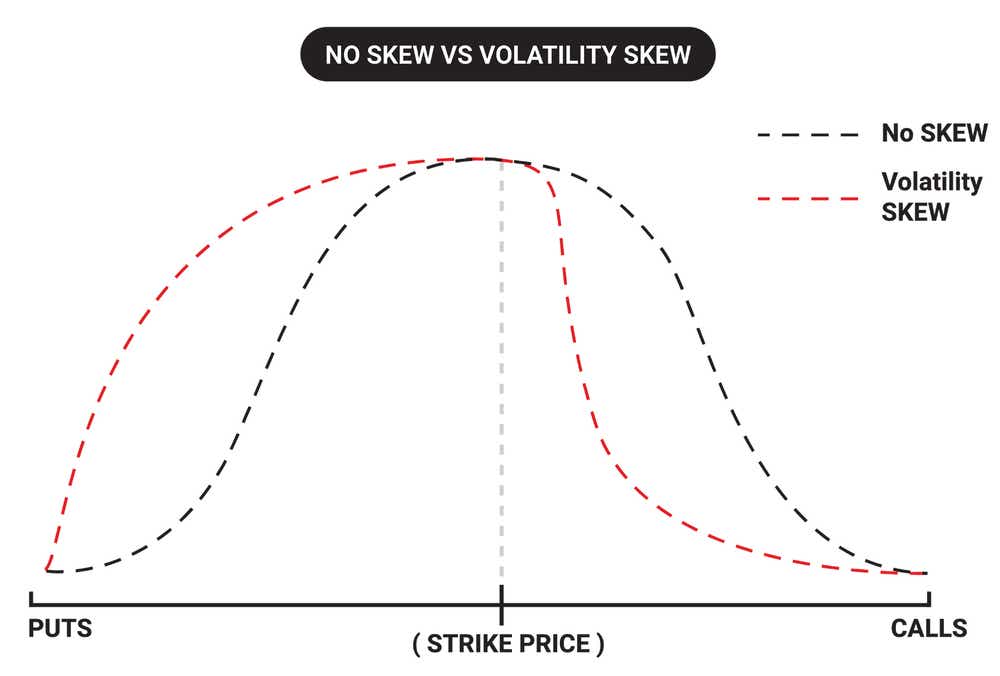
In the options universe, the term "volatility skew" refers to the uneven distribution of implied volatility across different strike prices and expiration dates of options contracts. Implied volatility reflects the market's expectation of future price movements for the underlying asset. The volatility skew therefore illustrates how this expectation varies depending on the option's strike price and time to expiration.
Typically, at-the-money (ATM) options tend to have higher implied volatility compared to out-of-the-money (OTM) options. That means options with strike prices that are close in value to the underlying stock/ETF price will have higher implied volatility, while upside calls often have lower implied volatility. Downside OTM puts may also exhibit higher levels of implied volatility due to firm demand for these options.
Downside puts are often used for hedging, which can help mitigate losses in the event of a sharp market correction. The presence of a volatility skew is therefore primarily attributable to market participants' expectations and perceptions of risk. In general, skew tends to be structured such that higher risk options exhibit higher levels of implied volatility, while lower risk options exhibit lower levels of implied volatility, all else being equal.
For example, during times of heightened uncertainty or market turbulence, investors may demand greater downside protection, leading to elevated implied volatility for out-of-the-money puts. Similarly, in bullish markets, there may be less demand for downside protection, resulting in relatively lower implied volatility for out-of-the-money puts compared to at-the-money or in-the-money options.
Traders and investors closely monitor volatility skew as it can provide important insights into market sentiment. A skew analysis can likewise help an options market participant assess the relative pricing of options across different strike prices and expiration dates, guiding their potential trading strategies.
Moreover, changes in the volatility skew over time can signal a shift in market dynamics or investor sentiment, which may influence trading and risk management decisions. Overall, understanding and interpreting volatility skew is essential for effectively navigating options markets and managing associated portfolio risk.
What’s the difference between negative skew, neutral skew and positive skew?
Negative skew in the options market refers to a scenario where out-of-the-money (OTM) put options exhibit higher implied volatility compared to at-the-money (ATM) or in-the-money (ITM) options. This implies that market participants are willing to pay a premium for downside protection, reflecting a bearish sentiment or heightened uncertainty regarding potential price declines. In such cases, the volatility skew slopes downward to the left, indicating a stronger demand for protective puts relative to bullish call options. Negative skew is often the “normal” structure of skew in the options marketplace.
Neutral skew occurs when the implied volatility of options remains relatively consistent across different strike prices and expiration dates. In other words, there is little to no significant difference in implied volatility between out-of-the-money, at-the-money, and in-the-money options. This suggests a balanced market sentiment without a pronounced bias towards either bullish or bearish expectations, resulting in a flat or minimal volatility skew.
Positive skew (aka reverse skew), on the other hand, manifests when out-of-the-money call options exhibit higher implied volatility compared to other options. This suggests that market participants are willing to pay a premium for upside potential, reflecting bullish sentiment, or the potential for sudden/dramatic upward swing in the underlying price. In these instances, volatility skew slopes upward to the right, indicating a stronger demand for bullish call options relative to protective puts.
How does volatility skew work?
Supply and demand dynamics in the options marketplace play a crucial role in shaping volatility skew. In turn, that means changes in supply and demand for options contracts can impact the pricing of options, and consequently influence the structure of volatility skew.
Typically, options with lower strike prices, especially out-of-the-money puts and in-the-money calls, tend to have higher implied volatility compared to options with higher strike prices, resulting in a “normal” negative skew.
A shift in volatility skew can significantly impact the options market and trading strategies. For instance, if there's a notable increase in the demand for downside protection due to heightened market uncertainty or perceived risks, the volatility skew may steepen, leading to higher implied volatility for out-of-the-money puts relative to other options. In this scenario, traders may adjust their strategies by purchasing out-of-the-money puts to hedge against potential downside risk, or elect to sell overpriced options to take advantage of inflated premiums.
Conversely, if market sentiment becomes more bullish, resulting in reduced demand for downside protection, the volatility skew may flatten or even shift towards positive skew. This change would generally indicate lower implied volatility for out-of-the-money puts compared to at-the-money options, potentially prompting traders to adjust their strategies by buying downside puts, or selling upside calls to capitalize on this type of shift.
Positive skew (aka reverse skew) is often observed in the gold market, because gold tends to be a safe haven. As such, the demand for gold can surge during a stock market correction. This unique dynamic indicates that call options possess elevated risk - due to the risk of a sudden price spike - which is why gold-focused options often exhibit positive skew (aka reverse skew).
Overall, volatility skew serves as a valuable tool for options traders and investors, providing valuable insights into market sentiment, perceived risks, and potential opportunities. By understanding and analyzing volatility skew, market participants can adjust their outlook and trading approaches with the intent of profiting from outcomes that capitalize on existing market conditions.
What is reverse skew?
Positive skew (aka reverse skew) usually manifests when out-of-the-money call options exhibit higher implied volatility compared to other options. This suggests that market participants are willing to pay a premium for upside potential, reflecting bullish sentiment or expectations of potential price increases. In such instances, the volatility skew usually slopes upward to the right, indicating a stronger demand for bullish call options relative to protective puts.
Positive skew (aka reverse skew) is often observed in the gold market, because gold tends to be a safe haven. As such, the demand for gold can surge during a stock market correction. This unique dynamic indicates that call options possess elevated risk - due to the risk of a sudden price spike - which is why gold-focused options often exhibit positive skew (aka reverse skew).
What is forward skew?
Forward skew, also known as term structure skew or time skew, refers to the variation in implied volatility across different expiration dates of options contracts on the same underlying asset. Unlike traditional volatility skew, which compares implied volatility across different strike prices at a single point in time, forward skew examines the structure of implied volatility over time.
Forward skew typically manifests in a couple of different ways, as outlined below:
Volatility Term Structure: In some cases, implied volatility tends to increase as the time to expiration lengthens. This phenomenon, known as a forward volatility term structure, suggests that market participants anticipate greater uncertainty or potential price fluctuations further into the future. As a result, options with longer expiration dates may command higher implied volatility compared to near-term options.
Flattening or Steepening: Forward skew can also flatten or steepen depending on changes in market sentiment. For instance, if there's a sudden increase in uncertainty or a significant event on the horizon, implied volatility for near-term options may spike, causing forward skew to flatten or even invert.
Changes in forward skew can provide clues about potential shifts in volatility, about upcoming events, or about changes in overall market dynamics. Traders may adjust their options strategies accordingly, taking advantage of perceived mispricings, or positioning themselves for anticipated volatility changes. Overall, an understanding of forward skew is essential for effectively navigating the options market, and managing risk over different time horizons.
How to use volatility skew
Volatility skew plays a crucial role in options trading strategies by providing insights into market sentiment, expectations, and perceived risks. Options traders often analyze volatility skew to gauge the relative pricing of options across different strike prices and expiration dates, in order to identify potential mispricings and opportunities for profit.
Traders utilize volatility skew in various options trading situations, and tailor their strategies to prevailing market conditions. For instance, in a scenario of negative skew, where downside protection commands higher implied volatility, a trader may employ a strategy that benefits from a decline in volatility, or a shift from negative skew to neutral skew. On the other hand, in a positive skew environment, where upside potential is favored, a trader may lean toward strategies like covered calls to try and take advantage of elevated levels of implied volatility, and inflated premiums.
Options market participants should keep in mind that implied volatility may be elevated for a good reason, and should therefore manage associated risks accordingly. That means elevated levels of implied volatility don’t always represent a good opportunity to sell options/volatility, just as depressed levels of implied volatility don’t always represent a good opportunity to buy options/volatility.
In that regard, the existence and shape of skew in a given market is just one of the many factors that options traders need to consider when building potential trading ideas. Sharp changes in the structure of skew should be approached cautiously, to ensure one understands the reasons behind such a shift, and how that shift may affect the overall risk environment.
Volatility skew example
Looking at an example, consider hypothetical stock ABC Inc., which is currently trading at $100 per share. The options market for ABC Inc. exhibits a negative volatility skew, indicating higher implied volatility for out-of-the-money put options compared to at-the-money or in-the-money options.
Skew Structure: The volatility skew for ABC Inc. indicates higher implied volatility for out-of-the-money put options compared to at-the-money or in-the-money options. This suggests that market participants are willing to pay a premium for downside protection, which is the “normal” structure of skew due to the natural demand for protection (e.g. puts) in the marketplace.
Situation: Imagine that an active put seller enters the market and is crossing the bid-ask spread to sell the $100-strike puts at the bid price (as opposed to mid-market). You are considering a potential trade in ABC Inc and hold a bearish near-term outlook on the shares. As such, you are considering a bear put spread (aka put vertical spread), which involves buying the higher-strike put in favor of simultaneously selling a lower strike put.
Trade Setup: In this case, ABC Inc. is exhibiting “normal” negative skew, which means there’s nothing noticeably amiss in the structure of the skew. Most symbols exhibit negative skew, due to the natural bid for protection (e.g. puts) in the marketplace. And by utilizing the bear put spread strategy, the trader can potentially profit from a bearish outlook on ABC Inc.
The existence of the active put seller in ABC Inc. provides you with the opportunity to express your bearish view by purchasing the $100-strike put on the bid, which is theoretically better than purchasing at the mid-point of the bid-ask, or at the offer price. And then to combine that long $100-strike put with a short $90-strike put.
The fact that there’s an active seller of the $100-strike puts provides an opportunity to complete the spread at attractive prices, therefore enhancing the overall risk-reward profile of the trade.
Execution:
Deploy orders to buy the $100-strike put, while simultaneously selling the $90-strike put. Consider specifying the total debit for the combined position when entering the orders into the execution platform. This helps ensure that one trade doesn't execute without the other, as both legs of the spread need to be filled to achieve the desired spread price.
Monitor the order book closely to ensure the orders are filled at the desired debit price. If necessary, adjust the overall debit price to improve the likelihood of execution.
Once the trade is filled, review the executed trade to confirm the net debit paid for initiating the spread. This net debit represents the maximum potential loss of the trade.
Risk Profile:
Maximum Potential Gain: The maximum potential gain for the bear put spread occurs if the price of ABC Inc. declines below the lower strike price of $90 by expiration. In this case, the spread would be worth the difference between the strike prices minus the net debit paid to initiate the spread.
Maximum Potential Loss: The maximum potential loss for the bear put spread is limited to the net debit paid to initiate the spread. This occurs if the price of ABC Inc. remains above the higher strike price of $100 by expiration.
Preferred Outcome:
The preferred outcome for the trader is for the price of ABC Inc. to decline significantly below the lower strike price of $90 by expiration. In this scenario, the trader would realize the maximum potential gain, which is the difference between the strike prices minus the net debit paid. If the price of ABC Inc. remains above the higher strike price of $100 by expiration, the trader would incur the maximum potential loss, which is limited to the net debit paid to initiate the spread.
Volatility skew key takeaways
Volatility skew is a crucial concept in options trading, providing insights into market sentiment, expectations, and perceived risks. It refers to the variation in implied volatility across different strike prices and expiration dates of options contracts on the same underlying asset.
Traditionally, volatility skew is observed by comparing implied volatility levels for out-of-the-money (OTM), at-the-money (ATM), and in-the-money (ITM) options at a single point in time. A negative skew occurs when OTM put options have higher implied volatility than ATM or ITM options, indicating a preference for downside protection. Conversely, a positive skew arises when OTM call options have higher implied volatility, suggesting a bias towards upside potential.
Forward skew, also known as term structure skew or time skew, examines implied volatility changes over time, reflecting evolving market expectations and sentiment. This forward-looking perspective provides valuable insights into potential shifts in volatility and market dynamics.
Volatility skew plays a crucial role in options trading strategies by providing insights into market sentiment, expectations, and perceived risks. Options traders often analyze volatility skew to gauge the relative pricing of options across different strike prices and expiration dates, in order to identify potential mispricings and opportunities for profit.
Volatility skew is therefore one of the many elements to consider when designing potential options trades. By understanding and interpreting volatility skew, traders can enhance their decision-making process and navigate the options market with greater ease and confidence.
tastylive content is created, produced, and provided solely by tastylive, Inc. (“tastylive”) and is for informational and educational purposes only. It is not, nor is it intended to be, trading or investment advice or a recommendation that any security, futures contract, digital asset, other product, transaction, or investment strategy is suitable for any person. Trading securities, futures products, and digital assets involve risk and may result in a loss greater than the original amount invested. tastylive, through its content, financial programming or otherwise, does not provide investment or financial advice or make investment recommendations. Investment information provided may not be appropriate for all investors and is provided without respect to individual investor financial sophistication, financial situation, investing time horizon or risk tolerance. tastylive is not in the business of transacting securities trades, nor does it direct client commodity accounts or give commodity trading advice tailored to any particular client’s situation or investment objectives. Supporting documentation for any claims (including claims made on behalf of options programs), comparisons, statistics, or other technical data, if applicable, will be supplied upon request. tastylive is not a licensed financial adviser, registered investment adviser, or a registered broker-dealer. Options, futures, and futures options are not suitable for all investors. Prior to trading securities, options, futures, or futures options, please read the applicable risk disclosures, including, but not limited to, the Characteristics and Risks of Standardized Options Disclosure and the Futures and Exchange-Traded Options Risk Disclosure found on tastytrade.com/disclosures.
tastytrade, Inc. ("tastytrade”) is a registered broker-dealer and member of FINRA, NFA, and SIPC. tastytrade was previously known as tastyworks, Inc. (“tastyworks”). tastytrade offers self-directed brokerage accounts to its customers. tastytrade does not give financial or trading advice, nor does it make investment recommendations. You alone are responsible for making your investment and trading decisions and for evaluating the merits and risks associated with the use of tastytrade’s systems, services or products. tastytrade is a wholly-owned subsidiary of tastylive, Inc.
tastytrade has entered into a Marketing Agreement with tastylive (“Marketing Agent”) whereby tastytrade pays compensation to Marketing Agent to recommend tastytrade’s brokerage services. The existence of this Marketing Agreement should not be deemed as an endorsement or recommendation of Marketing Agent by tastytrade. tastytrade and Marketing Agent are separate entities with their own products and services. tastylive is the parent company of tastytrade.
tastyfx, LLC (“tastyfx”) is a Commodity Futures Trading Commission (“CFTC”) registered Retail Foreign Exchange Dealer (RFED) and Introducing Broker (IB) and Forex Dealer Member (FDM) of the National Futures Association (“NFA”) (NFA ID 0509630). Leveraged trading in foreign currency or off-exchange products on margin carries significant risk and may not be suitable for all investors. We advise you to carefully consider whether trading is appropriate for you based on your personal circumstances as you may lose more than you invest.
tastycrypto is provided solely by tasty Software Solutions, LLC. tasty Software Solutions, LLC is a separate but affiliate company of tastylive, Inc. Neither tastylive nor any of its affiliates are responsible for the products or services provided by tasty Software Solutions, LLC. Cryptocurrency trading is not suitable for all investors due to the number of risks involved. The value of any cryptocurrency, including digital assets pegged to fiat currency, commodities, or any other asset, may go to zero.
© copyright 2013 - 2026 tastylive, Inc. All Rights Reserved. Applicable portions of the Terms of Use on tastylive.com apply. Reproduction, adaptation, distribution, public display, exhibition for profit, or storage in any electronic storage media in whole or in part is prohibited under penalty of law, provided that you may download tastylive’s podcasts as necessary to view for personal use. tastylive was previously known as tastytrade, Inc. tastylive is a trademark/servicemark owned by tastylive, Inc.
Your privacy choices