Filter
Contents
Shooting Start Chart Pattern Explained
Contents
What is the Shooting Star Candlestick Pattern?
In technical analysis, candlestick patterns often reveal shifts in market psychology before the headlines do. One of the more recognizable single-bar signals is the shooting star—a bearish reversal pattern that can indicate a rally may be running out of steam.
On its own, the pattern doesn’t guarantee a reversal. But when it appears after a strong advance, or near an established resistance level, the shooting star becomes a cautionary signal. For traders focused on price action, it serves as a visual cue that bullish momentum may be fading, and that risk of a pullback could be rising.
How to Identify the Shooting Star Chart Pattern
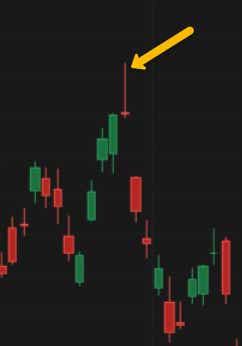
Identifying a shooting star on a candlestick chart is relatively straightforward, but context is what makes it meaningful. The pattern usually forms after an upswing, and is usually defined by a small real body near the session’s low—a long upper shadow at least twice the length of the body, and little to no lower wick. This structure demonstrates that buyers managed to push prices sharply higher during the session, but that sellers regained control by the close, leaving behind a candle that visually signals fading upside momentum.
The shooting star becomes more significant when it appears after a strong rally, and aligns with other signs of potential exhaustion. Traders often look for it near prior highs, psychological round numbers, or zones of heavy trading activity. On daily or weekly charts, the signal tends to carry more weight, especially if accompanied by slowing momentum, RSI divergence, or declining volume. In these instances, what begins as a simple one-bar pattern can serve as an early warning that a reversal may be on the horizon.
How to Trade the Shooting Star Pattern
At its core, the shooting star is a warning sign: buyers had control, drove prices sharply higher, and then lost their grip by the close. That reversal of power in a single session hints at exhaustion in the uptrend, but it isn’t a green light to trade just yet.
Patience is key. The real signal usually arrives when the market confirms the pattern—often when the next candle closes lower, ideally beneath the body of the shooting star. That follow-through shows that sellers aren’t just testing the waters, they’re taking charge.
From there, discipline matters as much as timing. Stops are often placed just above the shooting star’s high, because a break back through that level invalidates the bearish setup. On the profit side, traders look for logical downside targets—major support, prior swing lows, or simply a defined risk-to-reward ratio.
Context is what separates an average setup from a high-conviction one. A shooting star that forms at resistance, after an extended rally, or near a psychologically important level tends to carry more weight than one in the middle of a choppy market. When that context aligns with fading momentum, or softening volume, the pattern’s message becomes harder to ignore.
Shooting Star Chart Pattern Example
The following example shows how a trader might apply the shooting star pattern in practice. This is a hypothetical setup, meant to demonstrate how the signal can be used across markets such as stocks, futures, or even forex.
Imagine a large-cap tech stock that has been climbing steadily, moving from $210 to $232 in just two weeks. One afternoon, the stock opens at $231, rallies to $235, but then reverses sharply and closes near $231.50. The candle leaves behind a long upper wick with a small real body near the low—creating a textbook shooting star.
The next day, the stock opens weak and finishes below the body of the shooting star, giving traders the confirmation they look for. A trader acting on this setup might choose to short at $230.50, set a stop-loss just above the pattern’s high at $235.25, and aim for the $222–$224 support zone where price had previously consolidated.
This example underscores how a single candlestick—when placed in the right context and paired with a clear plan for entry, stops, and targets—can provide a structured way to participate in a potential reversal.
Shooting Star vs. Evening Star Chart Pattern
Both the shooting star and the evening star point to potential reversals, but they deliver their signals in very different ways.
The shooting star is fast and sharp. It forms in a single candle, with price spiking higher only to be rejected by the close. That swift intraday reversal makes it easy to spot and valuable as an early warning. Still, because it rests on just one candle, traders usually wait for follow-through in the next session before treating it as actionable.
The evening star, by contrast, takes its time. It unfolds across three candles: a strong bullish bar, then a small pause—often a doji or spinning top—and finally a powerful bearish candle that closes deep into the range of the first bar. This sequence tells a fuller story: buyers driving higher, hesitation creeping in, and sellers ultimately taking control.
That layered narrative is why evening stars are generally considered the stronger and more reliable reversal pattern. Shooting stars serve as quick alerts to fading momentum, while evening stars carry the weight of confirmation built into their very structure.
Shooting Star vs. Gravestone Doji Chart Pattern
The shooting star and the gravestone doji look similar at first glance, but the subtle details change the meaning. Both feature a long upper shadow and a close near the session’s low, signaling that higher prices were rejected.
The key difference is in the body. A gravestone doji has virtually no body at all—the open and close occur at nearly the same level. That makes it a picture of indecision after an attempted rally. The shooting star, by contrast, shows a small body. This suggests buyers briefly had the upper hand before sellers took back control in a more forceful way.
Context is what gives either pattern weight. Both are most meaningful after an advance, especially when they appear near prior highs or established resistance. In those spots, a gravestone doji often signals hesitation, while a shooting star leans more clearly bearish, pointing to active rejection of higher prices.
Neither pattern is typically traded in isolation. Traders tend to wait for confirmation—whether it’s a bearish close in the following session, fading momentum, or declining volume—to separate meaningful reversals from market noise. While the shooting star is often considered the stronger of the two signals, both can provide valuable clues when viewed in the proper context.
Shooting Star vs. Hanging Man Chart Pattern
The shooting star and the hanging man are both bearish reversal patterns, but they highlight weakness in different ways.
A shooting star forms at the top of an uptrend with a long upper wick and a small body near the session’s low. It shows that buyers tried to push the rally higher, only to be firmly rejected by sellers.
The hanging man also appears after an advance, but its structure is inverted: a long lower wick with a small body near the top. This tells a different story—sellers drove prices lower during the session, but buyers managed to recover by the close. On the surface that bounce looks positive, yet the deep shadow reveals growing selling pressure underneath the rally.
In simple terms, the shooting star signals failure to move higher, while the hanging man signals hidden weakness beneath the surface. Both patterns call for confirmation before traders act, whether through a bearish close in the next session, softening momentum, or a volume shift.
Shooting Star Chart Pattern Takeaways
- The shooting star is a single-candle bearish reversal pattern that often marks exhaustion near the top of a rally.
It typically features a small real body near the session low and a long upper shadow, showing that buyers were overpowered by sellers late in the session.
The signal often carries more weight when it forms at key resistance, prior swing highs, or major round-number levels.
A bearish close below the candle’s body in the following session is typically viewed as confirmation.
Traders often manage risk with stop-loss orders just above the shooting star’s high, while targeting nearby support or using a defined risk/reward ratio (e.g., 2:1).
Reliability typically improves when combined with other tools—such as volume, moving averages, or momentum indicators—that confirm weakening strength.
Shooting stars are often more effective on higher timeframes (daily or weekly charts), which filter out intraday noise and highlight broader sentiment shifts.
tastylive content is created, produced, and provided solely by tastylive, Inc. (“tastylive”) and is for informational and educational purposes only. It is not, nor is it intended to be, trading or investment advice or a recommendation that any security, futures contract, digital asset, other product, transaction, or investment strategy is suitable for any person. Trading securities, futures products, and digital assets involve risk and may result in a loss greater than the original amount invested. tastylive, through its content, financial programming or otherwise, does not provide investment or financial advice or make investment recommendations. Investment information provided may not be appropriate for all investors and is provided without respect to individual investor financial sophistication, financial situation, investing time horizon or risk tolerance. tastylive is not in the business of transacting securities trades, nor does it direct client commodity accounts or give commodity trading advice tailored to any particular client’s situation or investment objectives. Supporting documentation for any claims (including claims made on behalf of options programs), comparisons, statistics, or other technical data, if applicable, will be supplied upon request. tastylive is not a licensed financial adviser, registered investment adviser, or a registered broker-dealer. Options, futures, and futures options are not suitable for all investors. Prior to trading securities, options, futures, or futures options, please read the applicable risk disclosures, including, but not limited to, the Characteristics and Risks of Standardized Options Disclosure and the Futures and Exchange-Traded Options Risk Disclosure found on tastytrade.com/disclosures.
tastytrade, Inc. ("tastytrade”) is a registered broker-dealer and member of FINRA, NFA, and SIPC. tastytrade was previously known as tastyworks, Inc. (“tastyworks”). tastytrade offers self-directed brokerage accounts to its customers. tastytrade does not give financial or trading advice, nor does it make investment recommendations. You alone are responsible for making your investment and trading decisions and for evaluating the merits and risks associated with the use of tastytrade’s systems, services or products. tastytrade is a wholly-owned subsidiary of tastylive, Inc.
tastytrade has entered into a Marketing Agreement with tastylive (“Marketing Agent”) whereby tastytrade pays compensation to Marketing Agent to recommend tastytrade’s brokerage services. The existence of this Marketing Agreement should not be deemed as an endorsement or recommendation of Marketing Agent by tastytrade. tastytrade and Marketing Agent are separate entities with their own products and services. tastylive is the parent company of tastytrade.
tastyfx, LLC (“tastyfx”) is a Commodity Futures Trading Commission (“CFTC”) registered Retail Foreign Exchange Dealer (RFED) and Introducing Broker (IB) and Forex Dealer Member (FDM) of the National Futures Association (“NFA”) (NFA ID 0509630). Leveraged trading in foreign currency or off-exchange products on margin carries significant risk and may not be suitable for all investors. We advise you to carefully consider whether trading is appropriate for you based on your personal circumstances as you may lose more than you invest.
tastycrypto is provided solely by tasty Software Solutions, LLC. tasty Software Solutions, LLC is a separate but affiliate company of tastylive, Inc. Neither tastylive nor any of its affiliates are responsible for the products or services provided by tasty Software Solutions, LLC. Cryptocurrency trading is not suitable for all investors due to the number of risks involved. The value of any cryptocurrency, including digital assets pegged to fiat currency, commodities, or any other asset, may go to zero.
© copyright 2013 - 2026 tastylive, Inc. All Rights Reserved. Applicable portions of the Terms of Use on tastylive.com apply. Reproduction, adaptation, distribution, public display, exhibition for profit, or storage in any electronic storage media in whole or in part is prohibited under penalty of law, provided that you may download tastylive’s podcasts as necessary to view for personal use. tastylive was previously known as tastytrade, Inc. tastylive is a trademark/servicemark owned by tastylive, Inc.
Your privacy choices