Filter
Contents
Implied Volatility In Options Trading: All You Need to Know
Contents
What Is Implied Volatility (IV)?
Implied volatility (IV) in the market refers to the forecasted magnitude, or one standard deviation (SD) range, of potential movement away from the underlying price in a year's time.
IV is not a guaranteed metric, but it’s helpful in traders understanding ranges from a statistical perspective to help with risk management, buying power etc
Low implied volatility environments tell us that the market isn’t expecting the stock price to move much from the current stock price over the course of a year. Whereas, a high implied volatility environment tells us that the market is expecting large movements from the current stock price over the course of the next twelve months.
Implied volatility is an annualized expected move in the underlying stocks price, adjusted for the expiration duration.
The tastytrade platform displays IV in several useful areas on its interface. One of them is to simply view volatility by expiration in the trade tab. The example below shows monthly expirations for SPY over the next 365 days. The +- number is the expected move of the underlying price given the current implied volatility percentage (IV%), adjusted for the expiration timeframe.
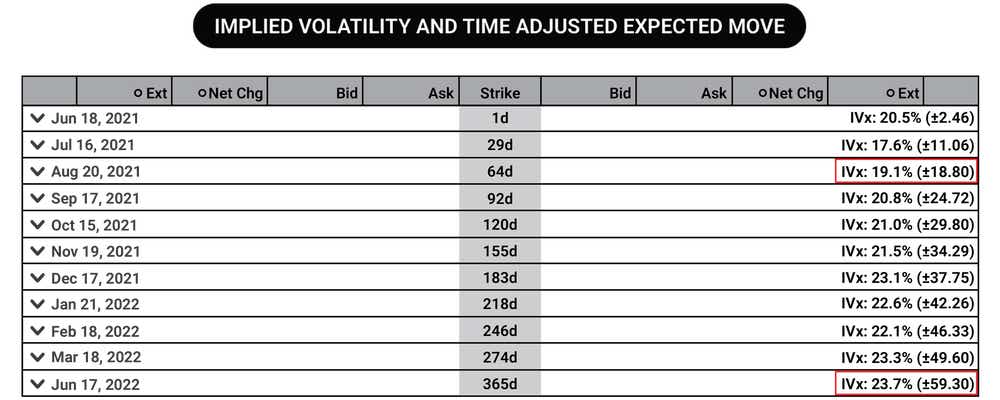
In the SPY example above, we see that over the next 64 days, the market is expecting a 19.1% implied volatility, which translates to an implied $18.80 range above or below the current stock price of $423.00. In other words, the current implied volatility and timeframe implies a $37.60 potential range from the current stock price, or between $404.20 and $441.80.
Over the course of 365 days, the implied volatility is 23.7%, which implies a move of ± $59.30 above or below the current stock price of $423.00, that’s a range of $118.60, or between $363.70 and $482.30.
How Does Implied Volatility Work?
Implied volatility involves using a mathematical formula to forecast the likely movement of a stock. It’s important to note that implied volatility cannot predict the direction in which the price change will proceed – in other words, whether the price will go up, down or see-saw between the two variables or go beyond. It can only forecast the likely movement level in a security’s price.
Implied volatility can be used to determine a stock’s expected move over a given expiration cycle. You can find the implied volatility of a stock for different expirations using the Black-Scholes model. These implied ranges are based on annual expected moves by default.
At tastylive, we use the ‘expected move formula’, which allows us to calculate the one standard deviation range of a stock. This is based on the days to expiration (DTE) of our option contract, the stock price, and the stock's implied volatility.
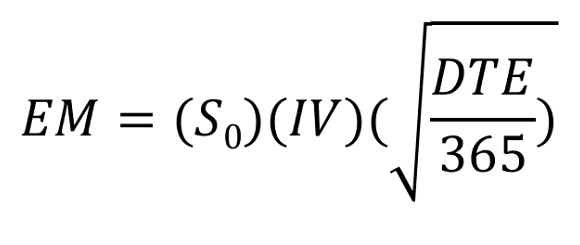 | EM = 1SD expected move S = stock price IV = implied volatility of your option’s expiration cycle DTE = days to expiration of your option contract |
For example, the 1SD expected move of a $100 stock with an IV percentage of 20% is around $20 of the current stock price, or a range between $80 and $120.
Before diving into how this impacts options trading, it’s important to understand the probabilities associated with certain multiples of standard deviations:
Think of any stock (or underlying product) you like, and consider tracking how many times in a row it goes up in price, or down in price, for consecutive days. Over a large window of time, you’ll see that the vast majority of stock price movement would land in the 1SD range of outcomes, or 68.2% of the time. And 95.4% of the time with a 2SD range and 99.7% with a 3SD range.
This may be something like 1-3 days in a row moving in the same direction. Going out to 2SD would certainly have fewer occurrences and would track something like 4-7 days in a row moving in the same direction. 3SD would encompass the fewest occurrences of 7+ days in a row moving in the same direction.
The highest number of occurrences will generally encompass what we expect, and the lowest number of occurrences will encompass outlier events sometimes called a black swan.
- A low IV tells us that the market isn’t expecting the current stock price to move much over the course of a year or a given timeframe
- A high IV tells us that the market is expecting large movements from the current stock price over the next 12 months
- When equity prices decline over time, It’s called a bearish market, which is riskier for long-term bullish investors. In this type of market, implied volatility is likely to increase
- When prices rise over time, it’s referred to as a bullish market and IV is more likely to decrease
How Does Implied Volatility Affect Options?
Implied volatility affects options by being one of the deciding factors in its pricing, as it estimates the future value of an option while considering its current value. Implied volatility is a measure of perceived volatility, so it’s important to keep an eye on it so that you know what kind of product you’re trading straight off the bat.
Implied volatility gives us context around option prices and what those prices predict in terms of potential stock price movements. This context is especially helpful for earnings trades, where you’re estimating the expected effect of the earnings announcement and strategizing around that.
Implied volatility can be used in several ways when trading options, including:
- Determining option prices
- Calculating the expected move of the underlying asset
- Measuring directional risk
High IV products tend to move around a lot, even if it isn’t in one direction, so it’s important to consider this when factoring in risk or determining an options strategy.
Conversely, high IV products offer higher extrinsic value premiums than low IV products, which is why short premium options traders tend to be drawn to it. Low IV environments equate to lower priced options due to a lack of extrinsic value; and high IV environments equate to higher priced options due to the abundance of extrinsic value.
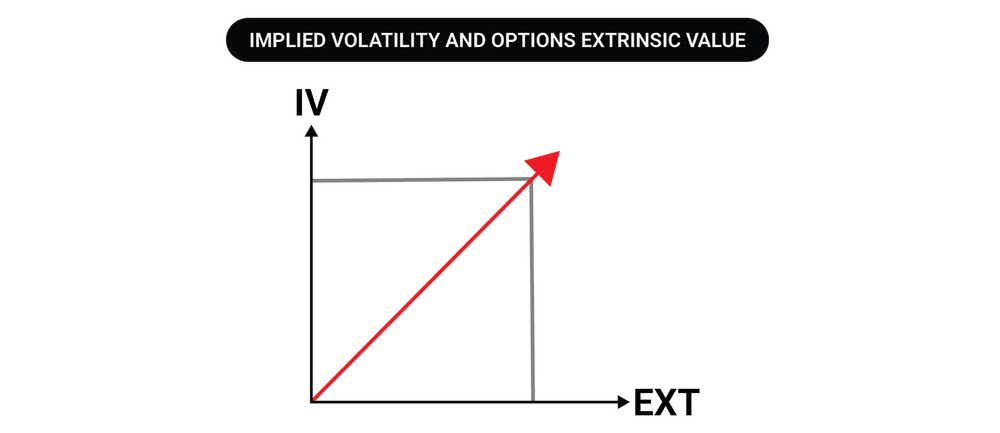
IV and extrinsic value in options prices always share a positive relationship.
- Higher extrinsic value in an options prices leads to higher implied volatility and lower option prices lead to lower implied volatility
- The buyer of a call and seller of a put could potentially make larger intrinsic value profits from higher IV if the stock moves up in a big way quickly
- The buyer of a put and seller of a call could potentially suffer larger losses from higher IV if the stock moves up in a big way quickly
- Time is working against a long option holder, which means each day the underlying doesn't get closer to their strike or past it, the long holder is relying on an extreme move to make up for lost time value
- If there’s a high demand for an option, the extrinsic value premium will rise, which drives implied volatility higher
Options Pricing Models
Options pricing that you see, analyze and trade are controlled by sophisticated mathematical models. These models are not necessary to master as they’re built into the platforms you use for trading. In this section, we’re going to look at the Black-Scholes model, and the Binomial model.
Black-Scholes Model
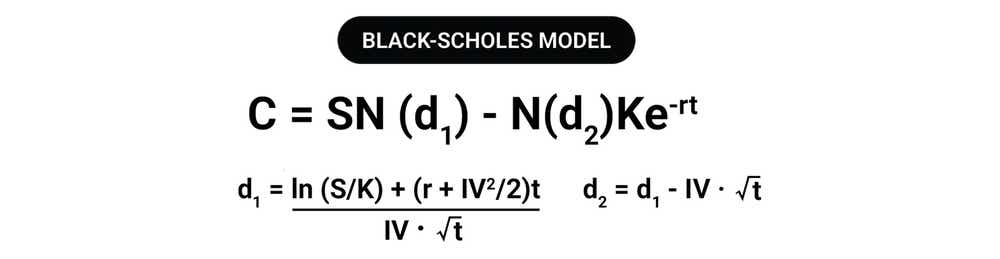
Implied volatility is primarily derived from the Black-Scholes model, which is quick in its calculation of option prices. This model requires to have all other inputs (stock price, expiration, etc.) to solve for IV%. One of the common misconceptions is that implied volatility drives options prices, but it’s actually the other way around; changes in options prices allows us to find a new value for IV.
The Black-Scholes model is complex, and most trading platforms will offer IV% values and, possibly, expected move values as well.
To compute an options price, six inputs are required:
- Stock price
- Strike price
- Time to expiration (denoted as a percent of a year)
- Risk-free interest rate
- Dividends
- Implied volatility (which is the only unobserved variable on this list)
Here is how to work out IV with the Black-Scholes model.
|
|
Binomial Model
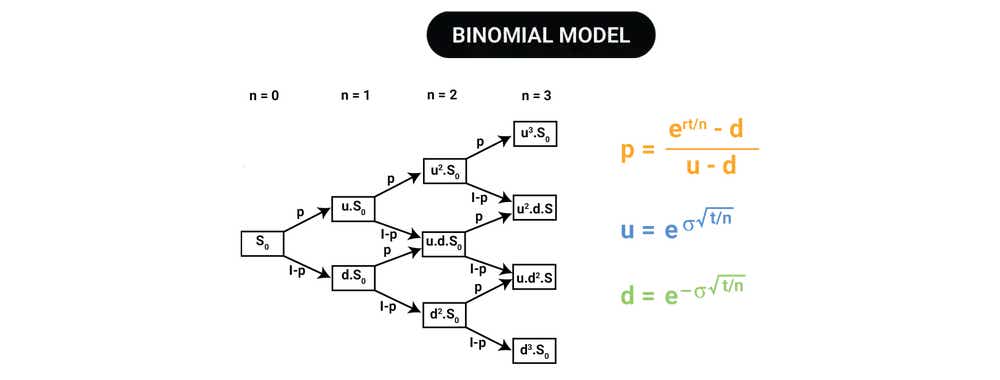
|
Implied Volatility Vs Realized Volatility: What’s The Difference
If you look at historical data IV tends to overstate actual realized volatility. The reason being that the fear of uncertainty is overblown, which leads to a positive outcome – option selling can be profitable for traders.
IV
Implied volatility (IV) represents the current market price for volatility , or the fair value of volatility based on the market's expectation for movement over a defined period of time
Realized Volatility
Realized volatility is the actual movement that occurs in a given underlying over a defined past period
How To Use Implied Volatility
To use implied volatility in options trading, follow these steps:
When you grasp how to use implied volatility, you’ll have a higher probability of success. After all, you want to minimize your risk and maximize your return as an investor. Understanding what implied volatility is telling you about a stock’s expected future movements is invaluable. It can greatly impact your strike choices, breakeven prices, max profit implications, and even your options trading strategy altogether, depending on how high or low IV is.
To understand how to use implied volatility, and then work out a strategy around it, you first need to grasp what IV levels can and cannot tell you.
IV levels can...
- Tell you how expensive option prices are, relatively speaking
- Help you measure market sentiment, i.e. the size of expected movement.
- Give consensus in the marketplace. For example the perceived fear of IV on the upside or downside can have a direct influence on the actual IV
- Give you many ways of being successful at expiration or before, even if your directional assumption is incorrect
.png?format=pjpg&auto=webp&quality=50&width=1000&disable=upscale)
Determine Whether Implied Volatility Is High Or Low
Determine whether IV is high or low, rising or falling, by looking at a metrics that shows the IV rank.
Many option traders will look at high or low IV when they choose an investment opportunity. This information can then be used in several ways, including:
- Determine when the underlying options are relatively cheap or expensive
- Help you predefine your trading conditions and know when to enter or exit your position
- Decide when to invest in more stable products, for instance during periods of high volatility
Buy perceived undervalued options and sell perceived overvalued options- Selling premium in high implied volatility environments to try to improve breakevens (compared to selling premium in low IV)
Implied volatility moves in cycles and traders need to monitor when IV reaches extreme highs or lows. In these instances, it’s expected to revert to its mean as it has shown mean reversion characteristics, historically speaking. This is just one aspect of options pricing though – a big directional move can offset this potential IV contraction.
.png?format=pjpg&auto=webp&quality=50&width=1000&disable=upscale)
Research Why Some Options Yield Higher Premiums
There will always be a reason why some options yield higher premiums due to high implied volatility. It could be a product approval, or news about a merger or acquisition. Typically, just before earnings announcements, the IV will plateau; then, after the event, it’s most likely to drop and revert to its mean.
You’ll need to do some research by keeping an eye on any stock market announcements, or other major news events to determine why option prices are higher and why there’s suddenly such a high demand for it. This could help you in gauging when it’s a good time to buy or sell.
Finding a potentially advantageous opportunity can be a key part of enhancing your position’s probability of success.
tastytrade empowers you to do this with tools such as:
- Our Follow Feed
- In-platform video feed
- Market watchlists
.png?format=pjpg&auto=webp&quality=50&width=1000&disable=upscale)
Identifying Options With High Implied Volatility For Short Premium Strategies
After you’ve done your research, you could identify options with high implied volatility that you might consider selling. You can sell options and still be bullish or neutral. As we mentioned before, this can improve your breakeven (compared to selling premium in low implied volatility environments).
In high IV environments, you can consider options selling strategies such as:
- Credit spreads
- Naked puts
- Short straddles/strangles
- Covered calls
Let’s take a look at an example using high IV.
One cool thing about the standard deviation (SD) of a stock and implied volatility is that when IV is high, we can obtain these 1SD probabilities using much wider strikes.
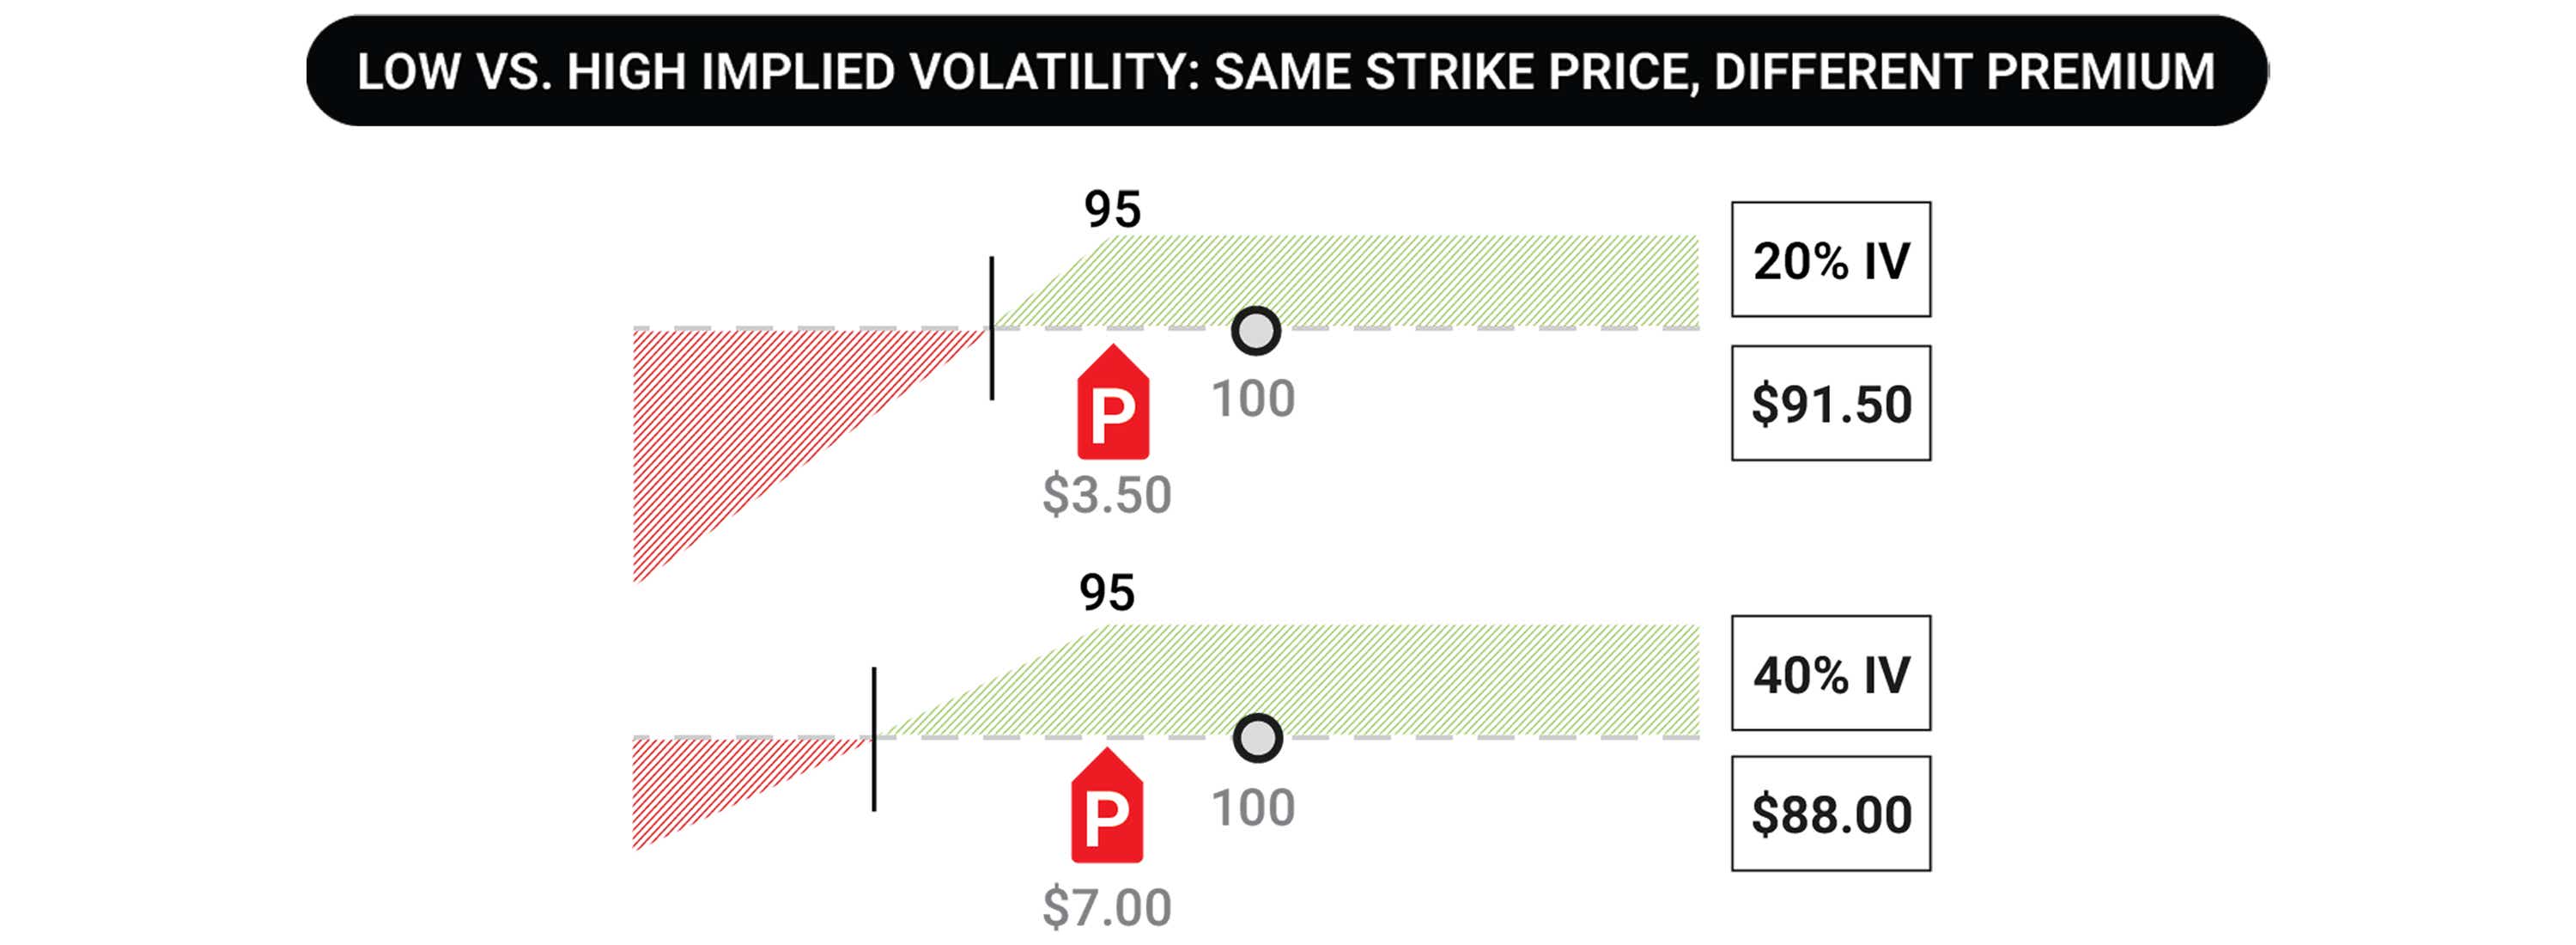
In the example above, let’s say you want to sell a put at the 95 strike with XYZ stock trading at $100. If implied volatility is high, the strike may be worth $7.00, where my maximum profit is $700 if the strike expires OTM. If it goes ITM, you can use that $7 in premium to reduce my breakeven to $88 if I took the shares.
In a low IV environment, the same strike might only be trading for $3.50, which is half the extrinsic value compared to the high IV environment. This means you get only half of the maximum profit, and half of the breakeven reduction against the strike.
That’s the power of high implied volatility, and how it affects the trade entry price, and proximity of the strike price from the stock price.
.png?format=pjpg&auto=webp&quality=50&width=1000&disable=upscale)
Identifying Options With Low Implied Volatility For Long Premium Strategies
When the implied volatility is low and the premiums are low-priced, it’s typically a buyers’ market.
In a low IV environment, you can consider options buying strategies such as:
- Debit spreads
- Naked long puts/calls
- Diagonal & calendar spreads
Let’s take a look at another example that shows the difference between a high and low IV environment:
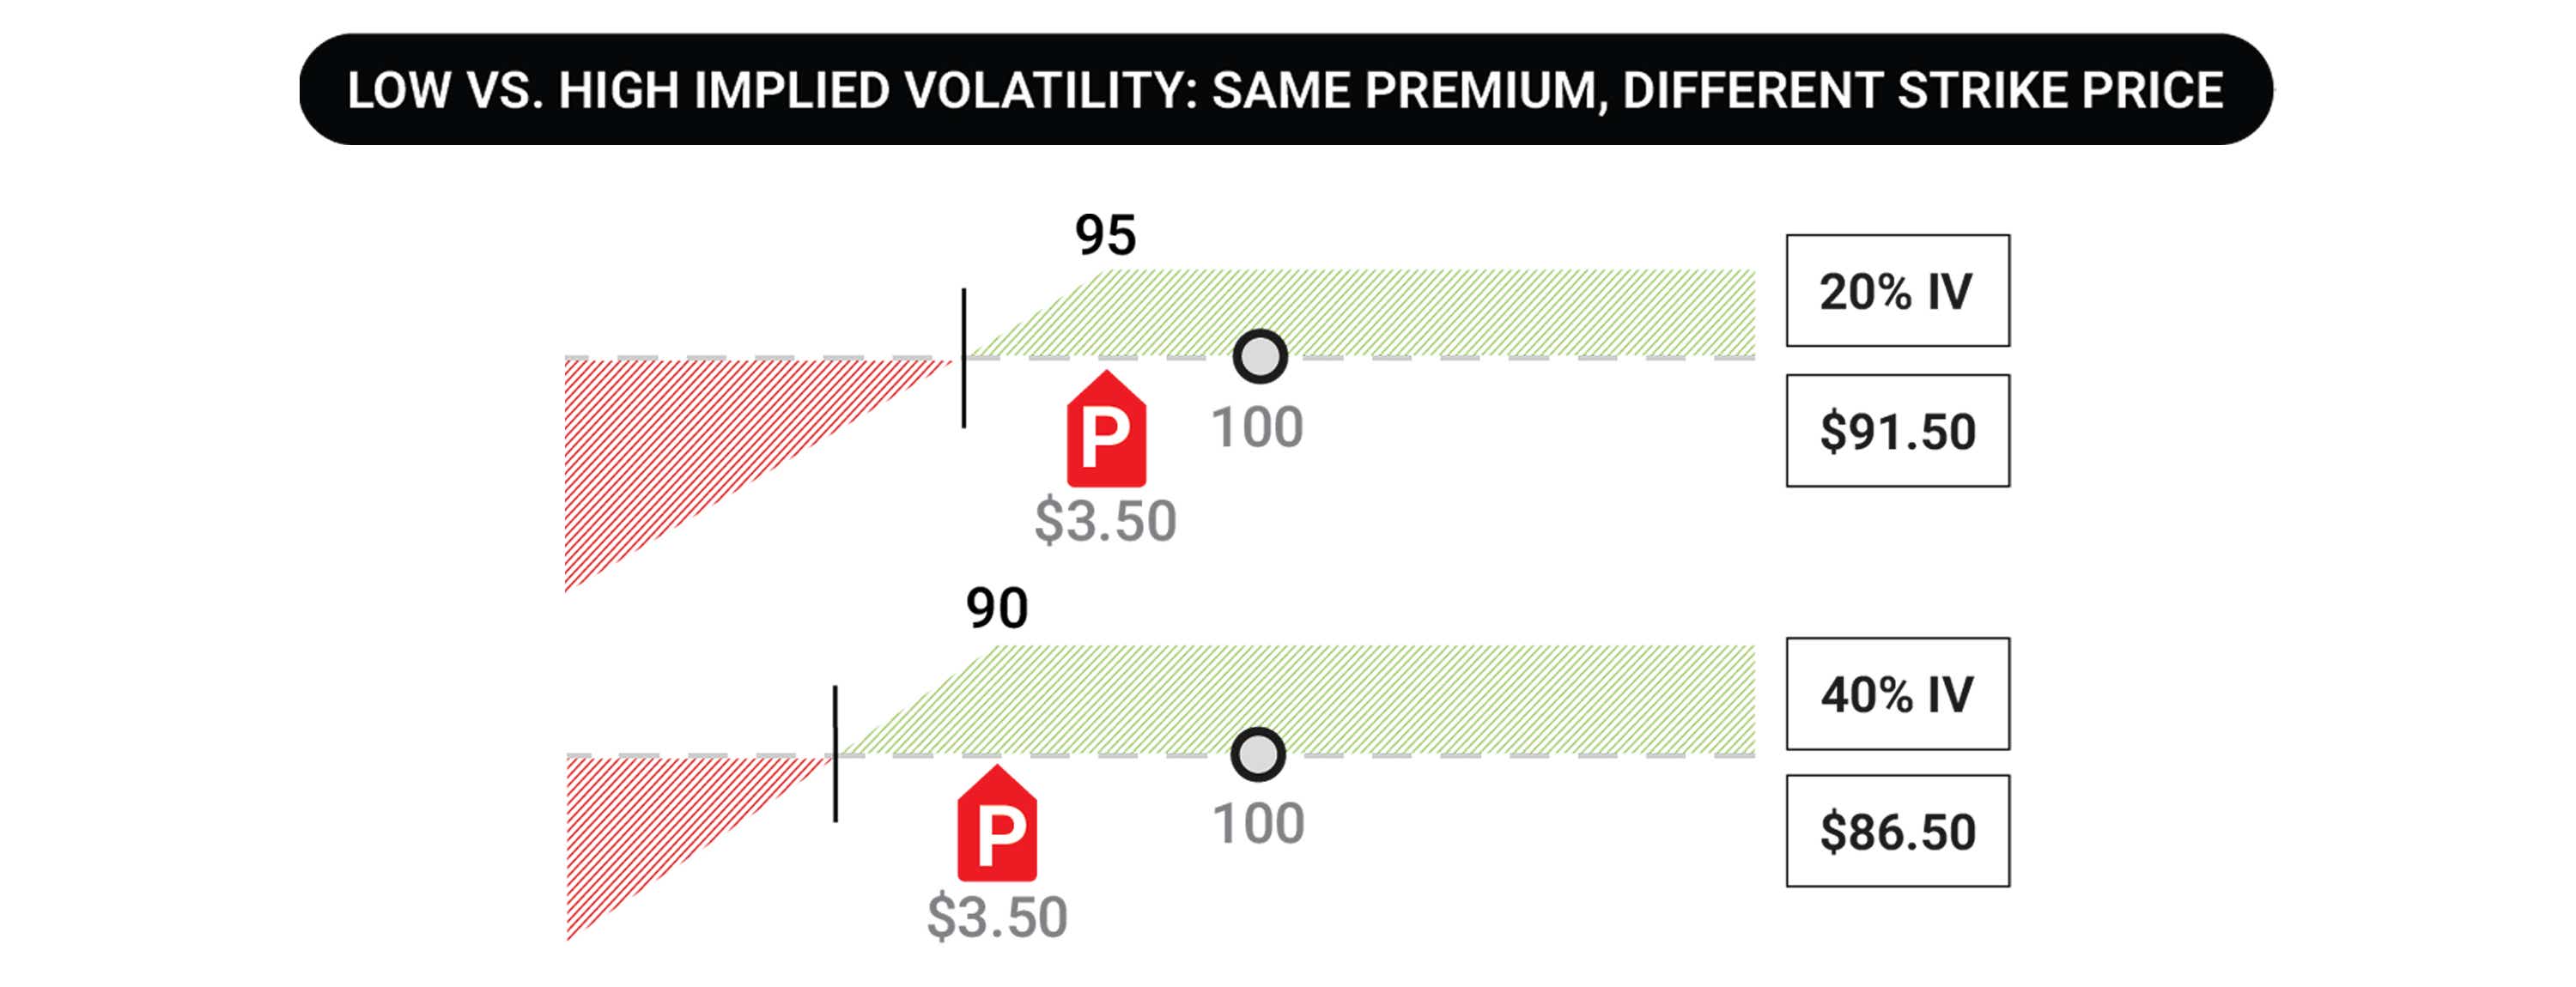
Suppose you’re just looking to collect $3.50 in extrinsic value premium for selling a put, and you want to take the stock if the put goes in the money (ITM). In a high IV environment, you may be able to go to the $90 strike to collect that $3.50, and your breakeven would be at $86.50 if you took the shares.
In a low IV environment, you could be at the $95 strike to collect that same $3.50 in premium. That means your breakeven for the shares would be $91.50, a full 5 points higher than the high IV environment’s strike.
Implied Volatility Example
In the below implied volatility example, you’ll see that by factoring in IV, you only take a 16% risk and have an 84% chance of success, which is great for probability traders. To capture a 1SD move in a strangle or iron condor, we combine the 84% OTM short call with the 84% OTM short put, and define our risk further OTM as we see fit – which then gives us around a 68% probability OTM.
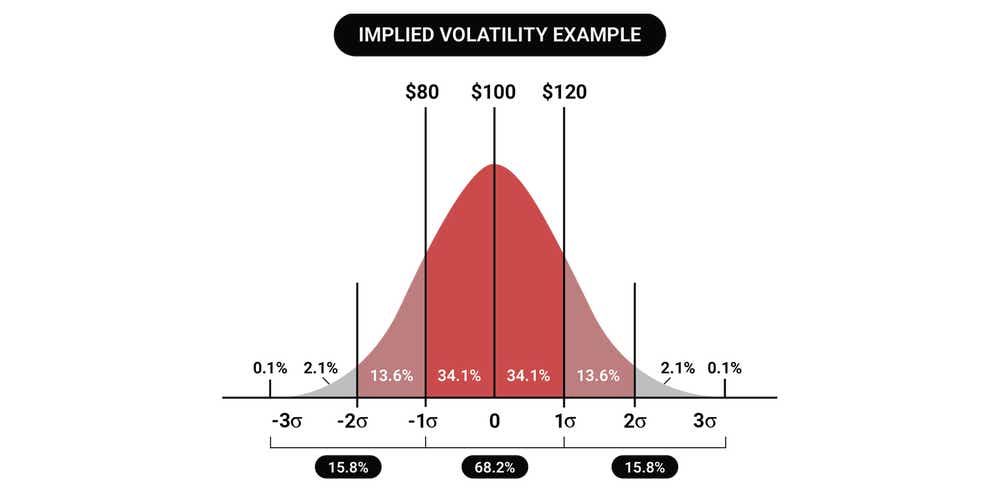
|
The dark red section in the implied volatility example shows that after 12 months (1SD), our stock that’s trading at $100, has a 68% chance of trading between $80 and $120. There is a chance that the stock will only be above $120, 16% of the time and below $80 also 16% of the time.
Here’s a practical scenario:
Stock is trading at $50, and the implied volatility of the option contract is 20%. This implies there’s a consensus in the marketplace that a one SD move over the next 12 months will be plus or minus $10 (since 20% of the $50 stock price equals $10).
Implied Volatility in Options Summary
- Implied volatility (IV) is a forward-looking forecast that’s crucial for estimating the expected range of an underlying asset’s price
- Implied volatility refers to the one standard deviation range of expected movement of a product’s price over the course of a year
- Option prices drive IV, not the other way around
- Option prices, specifically extrinsic value, and implied volatility have a positive correlation
- Expanding implied volatility is often followed by contracting implied volatility, and vice versa
- A high implied volatility environment will result in a wider one standard deviation (SD) than a low IV environment
- We can achieve the same premium target for short premium trades much further from the stock price in a high IV compared to a low IV environment
- You can use probabilities of an option expiring ITM or OTM to determine SD ranges
- SD indicates what the market perception is, based on implied volatility
Implied Volatility FAQs
What's implied volatility?
Implied volatility is the annual implied movement of a stock, presented on a one standard deviation (1 SD) basis. If XYZ stock has an implied volatility of 20% and it’s currently trading at $100 per share of the stock, the market is expecting it to move between a range of $80 and 120 over the course of a year, with a 68.2% probability of accuracy.
Is high implied volatility good or bad?
Implied volatility being high or low is dependent on the product itself as well as whether a trader is buying option premium (with debit spreads) or selling it (with credit spreads). For example, ETFs typically have lower implied volatility than single name equity products, because equities have a lot more implied movement due to binary events like earnings announcements. To see if IV is high or low for a particular product, we use contextual metrics like IV rank or IV percentile, which helps us see how current IV compares to an annual historical range.
What is a low implied volatility range?
Around 20-30% IV is typically what you can expect from an ETF like SPY. While these numbers are on the lower end of possible implied volatility, there is still a 16% chance that the stock price moves further than the implied volatility range over the course of a year.
How can I predict implied volatility?
Implied volatility is derived from the Black-Scholes model by entering relevant inputs and attempting to solve for IV by using options prices. One of the most common misconceptions is that IV drives options prices, but it’s actually the other way around.
What does implied volatility measure?
Implied volatility measures the annual, one standard deviation range of a stock price with an accuracy of 68.2%. Since there are many expirations that have lower timeframes than one year, the predicted movement of the stock can be adjusted using the expected move formula over the life of the options contract.
How does implied volatility affect options prices?
Implied volatility is derived from options prices, so changes in options prices affect IV.
High IV environments allow traders to collect more premium, or move strikes further away from the stock price and still collect a decent premium for short options strategies.
Low IV environments allow traders to speculate on long premium directional strategies at a lower cost than they would have to pay in a high IV environment, due to the lower extrinsic value and expected moves across the board.
What is considered a low implied volatility?
Low implied volatility for a specific product depends on where the historical range has been, and we can use IV rank or IV percentile to get a better gauge on the product we’re trading. Generally speaking, IV% in the teens for ETFs is relatively low, and the 20% to 30% range for equities is relatively low, depending on the product.
What is implied volatility in stocks?
Implied volatility in stocks is the perceived price movement derived from the options market of that particular stock. Implied volatility is presented on a one standard deviation, annual basis. If XYZ stock is trading at $100 per share with an IV% of 20%, the market perceives that the stock will be between $80-120 per share over the course of a year.
How does implied volatility affect delta?
Higher IV means wider expected ranges from the stock price, which means delta values are spread out much more than in a low IV environment.
Think of a low IV environment like a narrow, steep bell curve, where deltas drop off significantly and quickly as you move away from the stock price. Think of a high IV like a more flat, wide net where deltas are spread out much more evenly as you move away from the stock price. Out of the money (OTM) option deltas will be higher if you go 10 points away from the stock price in a high IV environment compared to a low IV environment.
Is implied volatility beneficial?
High implied volatility is beneficial to help traders determine if they want to buy or sell option premium. It also gives us an idea of how the market is perceiving the stock price to move over the course of a year. High IV means the stock could be more volatile than other low IV stocks.
Where can you find implied volatility of a stock?
The tastytrade platform and watchlists offers IV% values when you’re looking at the options chain of an underlying. On the platform you can quickly find the expected move numerically and graphically in the options chain! You can also use the watchlists. You can subscribe to tastylive newsletters which cover information about the IV of interesting stocks, futures, and ETFs.
Where can you find implied volatility of options?
Trading platforms like tastytrade offer implied volatility of options strikes and expiration cycles, as well as other IV metrics like IV rank and IV percentile. You can see the implied volatility of an option by changing one of the columns on the trade page to “Imp Vol”.
What does implied volatility percentage mean?
Implied volatility is presented on a percentage basis, so that you can quickly determine what that means for the stock you’re looking at. It gives implied volatility a more universal feel so you can see what products are projected to move a lot, or not move a lot at all.
Supplemental Content
Episodes on Implied Volatility
No episodes available at this time. Check back later!
tastytrade, Inc. and tastylive, Inc. are separate but affiliated companies.
tastylive content is created, produced, and provided solely by tastylive, Inc. (“tastylive”) and is for informational and educational purposes only. It is not, nor is it intended to be, trading or investment advice or a recommendation that any security, futures contract, digital asset, other product, transaction, or investment strategy is suitable for any person. Trading securities, futures products, and digital assets involve risk and may result in a loss greater than the original amount invested. tastylive, through its content, financial programming or otherwise, does not provide investment or financial advice or make investment recommendations. Investment information provided may not be appropriate for all investors and is provided without respect to individual investor financial sophistication, financial situation, investing time horizon or risk tolerance. tastylive is not in the business of transacting securities trades, nor does it direct client commodity accounts or give commodity trading advice tailored to any particular client’s situation or investment objectives. Supporting documentation for any claims (including claims made on behalf of options programs), comparisons, statistics, or other technical data, if applicable, will be supplied upon request. tastylive is not a licensed financial adviser, registered investment adviser, or a registered broker-dealer. Options, futures, and futures options are not suitable for all investors. Prior to trading securities, options, futures, or futures options, please read the applicable risk disclosures, including, but not limited to, the Characteristics and Risks of Standardized Options Disclosure and the Futures and Exchange-Traded Options Risk Disclosure found on tastytrade.com/disclosures.
tastytrade, Inc. ("tastytrade”) is a registered broker-dealer and member of FINRA, NFA, and SIPC. tastytrade was previously known as tastyworks, Inc. (“tastyworks”). tastytrade offers self-directed brokerage accounts to its customers. tastytrade does not give financial or trading advice, nor does it make investment recommendations. You alone are responsible for making your investment and trading decisions and for evaluating the merits and risks associated with the use of tastytrade’s systems, services or products. tastytrade is a wholly-owned subsidiary of tastylive, Inc.
tastytrade has entered into a Marketing Agreement with tastylive (“Marketing Agent”) whereby tastytrade pays compensation to Marketing Agent to recommend tastytrade’s brokerage services. The existence of this Marketing Agreement should not be deemed as an endorsement or recommendation of Marketing Agent by tastytrade. tastytrade and Marketing Agent are separate entities with their own products and services. tastylive is the parent company of tastytrade.
tastyfx, LLC (“tastyfx”) is a Commodity Futures Trading Commission (“CFTC”) registered Retail Foreign Exchange Dealer (RFED) and Introducing Broker (IB) and Forex Dealer Member (FDM) of the National Futures Association (“NFA”) (NFA ID 0509630). Leveraged trading in foreign currency or off-exchange products on margin carries significant risk and may not be suitable for all investors. We advise you to carefully consider whether trading is appropriate for you based on your personal circumstances as you may lose more than you invest.
tastycrypto is provided solely by tasty Software Solutions, LLC. tasty Software Solutions, LLC is a separate but affiliate company of tastylive, Inc. Neither tastylive nor any of its affiliates are responsible for the products or services provided by tasty Software Solutions, LLC. Cryptocurrency trading is not suitable for all investors due to the number of risks involved. The value of any cryptocurrency, including digital assets pegged to fiat currency, commodities, or any other asset, may go to zero.
© copyright 2013 - 2026 tastylive, Inc. All Rights Reserved. Applicable portions of the Terms of Use on tastylive.com apply. Reproduction, adaptation, distribution, public display, exhibition for profit, or storage in any electronic storage media in whole or in part is prohibited under penalty of law, provided that you may download tastylive’s podcasts as necessary to view for personal use. tastylive was previously known as tastytrade, Inc. tastylive is a trademark/servicemark owned by tastylive, Inc.
Your privacy choices