Filter
Standard Deviation Definition - How to Calculate & Use It with Stocks
What is Standard Deviation?
In statistics, standard deviation (SD) is a unit of measurement that quantifies certain outcomes relative to the average outcome.
Not only does standard deviation help traders quantify certain outcomes, it also shows us that while occurrences may appear random in the short term, the more occurrences we generate, the more consistent our results become. Thousands of occurrences typically start to create a bell curve around the median value.
This idea goes hand in hand with implied volatility (IV) in the stock market, which refers to the implied magnitude, or one standard deviation range, of potential movement away from the stock price in a year's time.
In other words, a low implied volatility environment tells us that the market is not expecting the stock price to move much away from the current stock price. This lack of implied volatility results in a range of outcomes with a narrow standard deviation of the stock near the current stock price.
A high implied volatility environment tells us that the market is expecting the stock price to move away from the current price with a greater magnitude. This high implied volatility results in a range of outcomes with a wide standard deviation away from the stock price.
How to Find Standard Deviation of a Stock
Finding the standard deviation of a stock can be cumbersome with the complexity of the Black-Scholes model, and these implied ranges are based on annual expected moves.
At tastylive, we use the expected move formula, which allows us to calculate the one standard deviation range of a stock based on the days-to-expiration (DTE) of our option contract, the stock price, and the implied volatility of a stock:
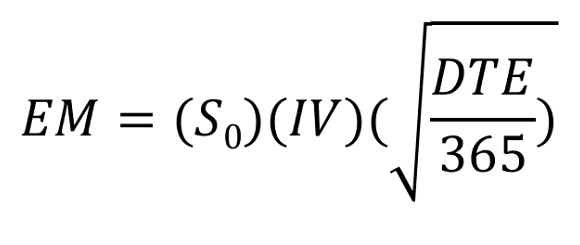
S = Stock Price
IV = Implied Volatility of your Option’s Expiration Cycle
DTE = Days to Expiration of your Option Contract
For example, the 1SD expected move of a $100 stock with an IV% of 20% is between +- $20 of the current stock price, or a range between $80 and $120.
Before diving into how it applies to options trading, it’s important to understand the probabilities associated with certain multiples of standard deviations:
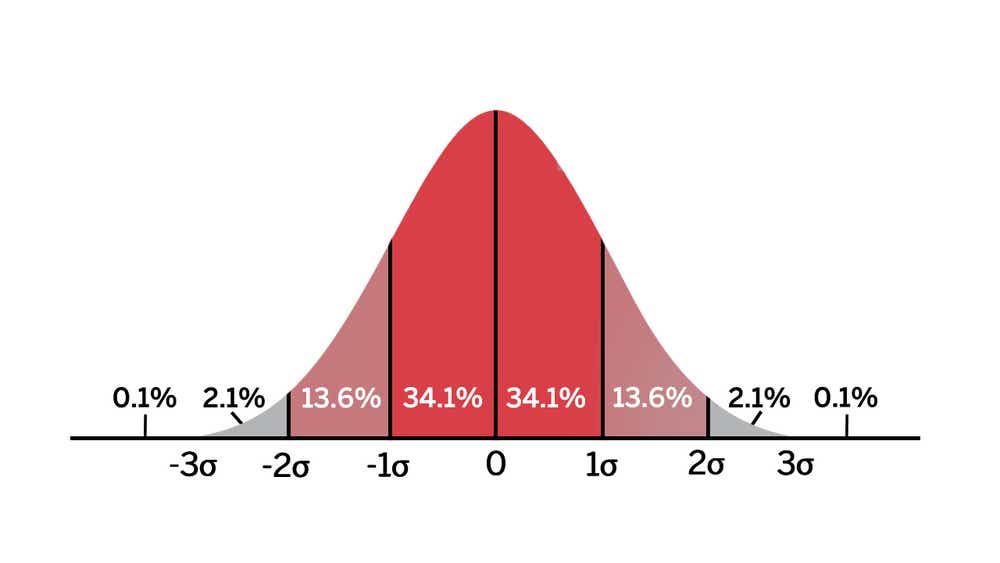
- One standard deviation of a stock encompasses approximately 68.2% of outcomes in a distribution of occurrences based on current implied volatility
- Two standard deviations of a stock encompasses approximately 95.4% of outcomes in a distribution of occurrences based on current implied volatility
- Three standard deviations of a stock encompasses approximately 99.7% of outcomes in a distribution of occurrences based on current implied volatility
Think of any stock you like, and consider tracking how many times in a row it goes up in price, or down in price, for consecutive days. Over a large window of time, you’ll see that the vast majority of stock price movement would land in the one standard deviation range of outcomes.
This may be something like 1-3 days in a row moving in the same direction. Going out to 2 standard deviations would certainly have less occurrences, and would track something like 4-7 days in a row moving in the same direction. 3 standard deviations would encompass the fewest occurrences of 7+ days in a row moving in the same direction.
As you can see, the highest number of occurrences will generally encompass what we expect, and the lowest number of occurrences will encompass outlier events.
What Does Standard Deviation Measure in a Portfolio?
The standard deviation of a particular stock can be quantified by examining the implied volatility of the stock’s options. The implied volatility of a stock is synonymous with a one standard deviation range in that stock. Remember, the higher the implied volatility is, the wider our standard deviation range of outcomes is.
EXAMPLE
- Between $80 and $120 for one standard deviation
- Between $60 and $140 for two standard deviations
- Between $40 and $160 for three standard deviations
CONCLUSION
- 68% probability of the stock closing between $80 and $120 a year from now
- 95% probability of the stock closing between $60 and $140 a year from now
- 99.7% probability of the stock closing between $40 and $160 a year from now
This example above may be considered a low implied volatility environment. In a high IV environment, maybe the IV is 40%. This would mean the one standard deviation range is now between $60 and $140. A much wider expected range will always be tied to higher and higher implied volatility values.
How Does Standard Deviation & Implied Volatility Apply to Options Trading?
Referring to the bell-curve image above, you can see that standard deviation is measured on both sides of the market. If we know that one standard deviation of a stock encompasses approximately 68.2% of outcomes in a distribution of occurrences, based on current implied volatility, we know that 31.8% of outcomes are outside of this range.
In options terms, “outside of the range” equates to the probability of an out-of-the-money (OTM) strike moving in-the-money (ITM). Remember though, this accounts for both sides of the market.
To find the probability for just one side of the market, we need to divide this 31.8% number in half, arriving at roughly 16%.
This is the figure we are looking for when viewing the probability of a strike expiring ITM, on a one standard deviation basis. Alternatively, we can look at the 84% probability of an option expiring OTM, which will land you on the same strike result. Both will give us strikes that encompass the range for roughly 68% of implied occurrences, which is how we get our one standard deviation range.
In most options trading platforms, the probability of a strike price being ITM is provided, we just need to remember a few probabilities in our strike prices:
- Strikes with a probability of 16% ITM / 84% OTM capture a one standard deviation range for an OTM option
- Strikes with a probability of 2.5% ITM / 97.5% OTM capture a 2 standard deviation range for an OTM option
One cool thing about the standard deviation of a stock & implied volatility is that when IV is high, we can obtain these probabilities using much wider strikes. Implied volatility is high, which means there is a larger implied range that the stock can move. That directly translates to higher probabilities of being ITM for further out strikes from a premium selling perspective, and being able to move strikes even further away from the stock to achieve a 1SD range compared to a low implied volatility environment. That’s the power of high implied volatility, and how it affects our trade entry and proximity from the stock price.
As you can see, understanding what implied volatility is telling you about a stock’s expected future movements is very valuable, and can change our options trading strategy altogether depending on how high or low IV is.
What's the Difference Between Standard Deviation vs Variance of Expected Return?
Standard deviation gives us a range of expectations around results. Variance refers to the very random nature of a small cluster of results. The lower our number of occurrences are, the more disconnected the results will be from expectation. Consider the coin flip again - over 10,000 occurrences I would expect the results to be 50/50 heads vs tails. Over just five occurrences though, I would not be surprised to see all of them land on heads. The higher our number of occurrences are, the more our actual results will align with expectations.
In trading, this tells us that even if we have a high probability trade or a strong assumption, we still need to account for the fact that the trade is just one occurrence, and we should prepare for the result to potentially be disconnected from expectation. Over a high number of trades though, we should expect our expected probabilities to align with real results.
10 Things to Know About Standard Deviation
- Standard Deviation gives us the expected range of outcomes based on the implied volatility of a product
- Implied volatility refers to the one standard deviation range of expected movement of a product’s price over the course of a year.
- A high implied volatility environment will result in a wider one standard deviation range than a low implied volatility environment
- If a $100 stock has a 20% implied volatility, the one standard deviation range of price outcomes would be between $80 and $120 for the year.
- Two and three standard deviation ranges encompass “outlier” outcomes that are not expected, but will happen from time to time.
- In options trading, you can use probabilities of an option expiring ITM or OTM to determine standard deviation ranges
- An option that has a 16% probability of expiring ITM represents the one standard deviation range for that expiration cycle.
- An option that has a 5% probability of expiring ITM represents the two standard deviation range for that expiration cycle.
- Standard deviation does not tell us where a stock will go, but it does indicate what the market perception is, based on implied volatility.
- Understand that variance plays a big role in the short term, so we need to account for this by keeping our individual position risk small.
Supplemental Content
Episodes on Standard Deviation
No episodes available at this time. Check back later!
tastylive content is created, produced, and provided solely by tastylive, Inc. (“tastylive”) and is for informational and educational purposes only. It is not, nor is it intended to be, trading or investment advice or a recommendation that any security, futures contract, digital asset, other product, transaction, or investment strategy is suitable for any person. Trading securities, futures products, and digital assets involve risk and may result in a loss greater than the original amount invested. tastylive, through its content, financial programming or otherwise, does not provide investment or financial advice or make investment recommendations. Investment information provided may not be appropriate for all investors and is provided without respect to individual investor financial sophistication, financial situation, investing time horizon or risk tolerance. tastylive is not in the business of transacting securities trades, nor does it direct client commodity accounts or give commodity trading advice tailored to any particular client’s situation or investment objectives. Supporting documentation for any claims (including claims made on behalf of options programs), comparisons, statistics, or other technical data, if applicable, will be supplied upon request. tastylive is not a licensed financial adviser, registered investment adviser, or a registered broker-dealer. Options, futures, and futures options are not suitable for all investors. Prior to trading securities, options, futures, or futures options, please read the applicable risk disclosures, including, but not limited to, the Characteristics and Risks of Standardized Options Disclosure and the Futures and Exchange-Traded Options Risk Disclosure found on tastytrade.com/disclosures.
tastytrade, Inc. ("tastytrade”) is a registered broker-dealer and member of FINRA, NFA, and SIPC. tastytrade was previously known as tastyworks, Inc. (“tastyworks”). tastytrade offers self-directed brokerage accounts to its customers. tastytrade does not give financial or trading advice, nor does it make investment recommendations. You alone are responsible for making your investment and trading decisions and for evaluating the merits and risks associated with the use of tastytrade’s systems, services or products. tastytrade is a wholly-owned subsidiary of tastylive, Inc.
tastytrade has entered into a Marketing Agreement with tastylive (“Marketing Agent”) whereby tastytrade pays compensation to Marketing Agent to recommend tastytrade’s brokerage services. The existence of this Marketing Agreement should not be deemed as an endorsement or recommendation of Marketing Agent by tastytrade. tastytrade and Marketing Agent are separate entities with their own products and services. tastylive is the parent company of tastytrade.
tastyfx, LLC (“tastyfx”) is a Commodity Futures Trading Commission (“CFTC”) registered Retail Foreign Exchange Dealer (RFED) and Introducing Broker (IB) and Forex Dealer Member (FDM) of the National Futures Association (“NFA”) (NFA ID 0509630). Leveraged trading in foreign currency or off-exchange products on margin carries significant risk and may not be suitable for all investors. We advise you to carefully consider whether trading is appropriate for you based on your personal circumstances as you may lose more than you invest.
tastycrypto is provided solely by tasty Software Solutions, LLC. tasty Software Solutions, LLC is a separate but affiliate company of tastylive, Inc. Neither tastylive nor any of its affiliates are responsible for the products or services provided by tasty Software Solutions, LLC. Cryptocurrency trading is not suitable for all investors due to the number of risks involved. The value of any cryptocurrency, including digital assets pegged to fiat currency, commodities, or any other asset, may go to zero.
© copyright 2013 - 2026 tastylive, Inc. All Rights Reserved. Applicable portions of the Terms of Use on tastylive.com apply. Reproduction, adaptation, distribution, public display, exhibition for profit, or storage in any electronic storage media in whole or in part is prohibited under penalty of law, provided that you may download tastylive’s podcasts as necessary to view for personal use. tastylive was previously known as tastytrade, Inc. tastylive is a trademark/servicemark owned by tastylive, Inc.
Your privacy choices