Filter
Contents
What is the Triple Bottom Chart Pattern & How to Trade it
Contents
What is the triple bottom chart pattern?
In technical analysis, chart patterns are used to identify potential shifts in market sentiment—helping traders anticipate reversals, breakouts, or continuation moves. The triple bottom is considered a bullish reversal pattern, often signaling that a prolonged downtrend is losing steam and that buyers are beginning to step in. What sets it apart is the extended period of consolidation it represents. Unlike single or double bottoms, a triple bottom reflects multiple failed attempts by sellers to push the price lower, which adds weight to the pattern once a breakout finally occurs.
In terms of mechanics, the pattern forms when the price tests a similar support level three times, bouncing higher after each dip but failing to break above a clear resistance zone—until the third attempt. This repeated testing of support often signals that sellers are running out of momentum, while buying interest is growing stronger. When the price eventually breaks above the resistance line that connects the highs between the lows, the triple bottom is considered confirmed. Some traders (depending on their outlook and approach) interpret this breakout as a buy signal, using it as an entry point for a long position in anticipation of a bullish trend reversal, or the start of a new upward move.
How does the triple bottom chart pattern work?
Price patterns reveal the underlying tug-of-war between fear and confidence—selling pressure and buying interest. A triple bottom emerges when a persistent downtrend begins to lose steam, and market participants can no longer drive prices meaningfully lower. This creates a kind of stalemate—where the asset repeatedly tests a support level but fails to break below it. Each rebound off that level signals growing buyer conviction, as the market starts to shift from defensive to opportunistic positioning.
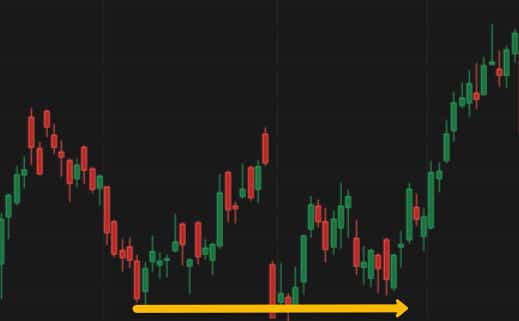
Structurally, the triple bottom unfolds through three distinct troughs, each forming near the same support zone. In between these lows, the price rallies but stalls beneath a consistent resistance level, forming two intermediate peaks. These failed breakouts reflect lingering caution—but also tightening price action, as the range compresses. On the third rebound, if bullish momentum builds enough to pierce resistance, the pattern is considered confirmed.
That breakout above resistance is a key signal: it suggests that buyers have finally overpowered sellers, marking the end of the downtrend and the potential start of a new uptrend. Traders often interpret this as a bullish entry point, especially when the breakout is accompanied by rising volume—a sign of strong participation and conviction behind the move.
How to trade the triple bottom chart pattern
For investors and traders, the triple bottom pattern is often viewed as a potential buying opportunity, signaling that a prolonged downtrend may be reversing. The key idea is that after three failed attempts to break below a strong support level, sellers are getting exhausted—and if the price finally breaks above the resistance line that formed between the prior highs, it may indicate that buyers have regained control. For this reason, the breakout is sometimes viewed as an attractive entry point for a long position.
To utilize the pattern, many traders wait for confirmation, which usually comes when the price closes decisively above the resistance level, ideally accompanied by an increase in volume. Waiting for this signal can help reduce the risk of a false breakout. Some traders may enter immediately after the breakout, while others may wait for a pullback to the breakout level—a “retest” of the old resistance as new support—before entering. Stop-loss orders are often placed just below the lowest of the three bottoms to manage downside risk.
When setting a price target, many traders use a simple projection method: they measure the height of the pattern—that is, the distance from the lowest point of the triple bottom to the resistance level—and then add that distance to the breakout point. This gives an estimated upside target if the pattern plays out as expected.
However, it’s important to remember that no chart pattern guarantees success. The triple bottom is believed to be most reliable when it features clear symmetry, a well-defined support level, and a decisive breakout. But without strong volume or follow-through, even a confirmed breakout can fail. As with any technical setup, this pattern is best used in conjunction with broader analysis—such as trend direction, momentum indicators, risk management principles, and the overall market environment.
Triple bottom chart pattern example
Let’s say a trader is analyzing the chart of a fictional stock called TSTY, which has been in a downtrend for several months. Around the $25 level, the price finds support and bounces three separate times over the course of a few weeks, forming three clear lows near the same horizontal zone. In between those lows, TSTY rallies to about $28 but fails to break above that level—establishing a visible resistance line. After the third bounce off support, momentum builds and the price starts climbing again toward $28.
At this point, the trader is watching closely for a breakout above the $28 resistance. Once TSTY closes above that level on strong volume—let’s say it breaks out to $29.20 with a noticeable uptick in trading activity—the trader sees this as confirmation of the triple bottom pattern. They enter a long position, anticipating a bullish move. To manage risk, they place a stop-loss order just below the lowest of the three bottoms, around $24.80. For a price target, they measure the height of the pattern—from the $25 support to the $28 resistance—and project a $3 move higher from the breakout point, aiming for an initial target near $32.
This example highlights how a trader uses the triple bottom to identify a shift in market sentiment, define entry and exit levels, and structure the trade with risk and reward clearly in mind. While every setup is different, the triple bottom offers a structured, visual approach to recognizing a potential reversal—especially when supported by volume and broader technical confirmation.
Triple bottom vs. the inverse head and shoulder pattern
While the triple bottom is a bullish reversal pattern that can signal a shift from downtrend to uptrend, the head and shoulders pattern is typically seen as a bearish reversal that occurs after a prolonged uptrend. The head and shoulders pattern consists of three peaks: a central, higher peak (the “head”) flanked by two smaller, lower peaks (the “shoulders”). It reflects a topping formation, where buying strength fades with each rally, eventually leading to a breakdown below the neckline—the support level connecting the lows between the shoulders. This breakdown is seen as a signal that sellers are taking control and a trend reversal may be underway.
In contrast, the triple bottom shows a base-building process at the end of a downtrend. Rather than weakening buying pressure, it signals strengthening demand as buyers repeatedly defend a support level. The triple bottom typically results in a breakout to the upside, whereas the head and shoulders pattern anticipates a breakdown. Both patterns rely on symmetry, identifiable support/resistance levels, and breakout confirmation, but they mirror opposite types of sentiment shifts. One suggests the market has found a floor and is preparing to rise; the other indicates the ceiling has been hit and downside momentum may be building. Traders often use these patterns together to map turning points in either direction—and to develop strategies that align with emerging trends.
Is the triple bottom pattern bullish or bearish?
The triple bottom is generally seen as a bullish signal, but its meaning depends on the broader context—how the price behaves before and during the pattern’s formation. Importantly, a triple bottom forms after a sustained downtrend, as the price tests the same support level three times, each time bouncing higher. This repeated support suggests that sellers are losing control and that sentiment may be shifting from bearish to neutral or even positive.
The pattern is confirmed when the price breaks above the resistance level formed by the highs between the lows. At that point, many traders view it as a bullish reversal—signaling the downtrend may be over and a new uptrend beginning. While the pattern isn’t clearly bullish during its formation, the breakout—especially if backed by strong volume—is what turns it into a potential buy signal.
Triple bottom chart pattern key takeaways
The triple bottom is a bullish reversal pattern that forms after a sustained downtrend, signaling a potential shift from bearish to bullish sentiment and often used as a setup for entering long positions.
It is defined by three distinct lows at roughly the same support level, separated by two moderate rallies that create a horizontal resistance line.
The pattern reflects seller exhaustion and growing buying interest, as the market repeatedly fails to push below support.
Confirmation occurs when the price breaks above resistance, typically viewed as a signal to initiate a long trade in anticipation of a new uptrend.
Breakouts are often accompanied by rising volume, reinforcing the strength of the reversal and improving confidence in the setup.
Traders may use the height of the pattern (from support to resistance) to estimate a potential upside target after the breakout.
Stop-loss orders are commonly placed below the lowest low to help manage downside risk in case of a false breakout.
The triple bottom pattern is most effective when supported by broader technical context, such as volume confirmation, trend analysis, and sound risk management—making it a valuable tool for identifying bullish entries and long opportunities.
tastylive content is created, produced, and provided solely by tastylive, Inc. (“tastylive”) and is for informational and educational purposes only. It is not, nor is it intended to be, trading or investment advice or a recommendation that any security, futures contract, digital asset, other product, transaction, or investment strategy is suitable for any person. Trading securities, futures products, and digital assets involve risk and may result in a loss greater than the original amount invested. tastylive, through its content, financial programming or otherwise, does not provide investment or financial advice or make investment recommendations. Investment information provided may not be appropriate for all investors and is provided without respect to individual investor financial sophistication, financial situation, investing time horizon or risk tolerance. tastylive is not in the business of transacting securities trades, nor does it direct client commodity accounts or give commodity trading advice tailored to any particular client’s situation or investment objectives. Supporting documentation for any claims (including claims made on behalf of options programs), comparisons, statistics, or other technical data, if applicable, will be supplied upon request. tastylive is not a licensed financial adviser, registered investment adviser, or a registered broker-dealer. Options, futures, and futures options are not suitable for all investors. Prior to trading securities, options, futures, or futures options, please read the applicable risk disclosures, including, but not limited to, the Characteristics and Risks of Standardized Options Disclosure and the Futures and Exchange-Traded Options Risk Disclosure found on tastytrade.com/disclosures.
tastytrade, Inc. ("tastytrade”) is a registered broker-dealer and member of FINRA, NFA, and SIPC. tastytrade was previously known as tastyworks, Inc. (“tastyworks”). tastytrade offers self-directed brokerage accounts to its customers. tastytrade does not give financial or trading advice, nor does it make investment recommendations. You alone are responsible for making your investment and trading decisions and for evaluating the merits and risks associated with the use of tastytrade’s systems, services or products. tastytrade is a wholly-owned subsidiary of tastylive, Inc.
tastytrade has entered into a Marketing Agreement with tastylive (“Marketing Agent”) whereby tastytrade pays compensation to Marketing Agent to recommend tastytrade’s brokerage services. The existence of this Marketing Agreement should not be deemed as an endorsement or recommendation of Marketing Agent by tastytrade. tastytrade and Marketing Agent are separate entities with their own products and services. tastylive is the parent company of tastytrade.
tastyfx, LLC (“tastyfx”) is a Commodity Futures Trading Commission (“CFTC”) registered Retail Foreign Exchange Dealer (RFED) and Introducing Broker (IB) and Forex Dealer Member (FDM) of the National Futures Association (“NFA”) (NFA ID 0509630). Leveraged trading in foreign currency or off-exchange products on margin carries significant risk and may not be suitable for all investors. We advise you to carefully consider whether trading is appropriate for you based on your personal circumstances as you may lose more than you invest.
tastycrypto is provided solely by tasty Software Solutions, LLC. tasty Software Solutions, LLC is a separate but affiliate company of tastylive, Inc. Neither tastylive nor any of its affiliates are responsible for the products or services provided by tasty Software Solutions, LLC. Cryptocurrency trading is not suitable for all investors due to the number of risks involved. The value of any cryptocurrency, including digital assets pegged to fiat currency, commodities, or any other asset, may go to zero.
© copyright 2013 - 2026 tastylive, Inc. All Rights Reserved. Applicable portions of the Terms of Use on tastylive.com apply. Reproduction, adaptation, distribution, public display, exhibition for profit, or storage in any electronic storage media in whole or in part is prohibited under penalty of law, provided that you may download tastylive’s podcasts as necessary to view for personal use. tastylive was previously known as tastytrade, Inc. tastylive is a trademark/servicemark owned by tastylive, Inc.
Your privacy choices