Using Technical Analysis to Forecast the Near Future of Eight Stock Indices

Using Technical Analysis to Forecast the Near Future of Eight Stock Indices
By:Tim Knight
Politics and warfare aside, we chart the major indices prospects for the remainder of the year
With the first 10 months of the year now out of the way, a mere one-sixth of 2023 remains. Considering how absolutely insane this year has been in all arenas (financial, geopolitical, legal, you name it), one can only imagine what the next two months might hold.
Instead of daring to speculate on the dozens of weighty matters already vexing the globe, I will simply focus on an octet of cash index charts along a common theme: the notion that each of them has hammered out a formidable and well-formed topping pattern and that, preposterous as it might seem to mainstream pundits (and flying in the face of endlessly cited bullish seasonality), it is within the realm of possibility that new lows for 2023 could be on hand for at least a few major indexes.
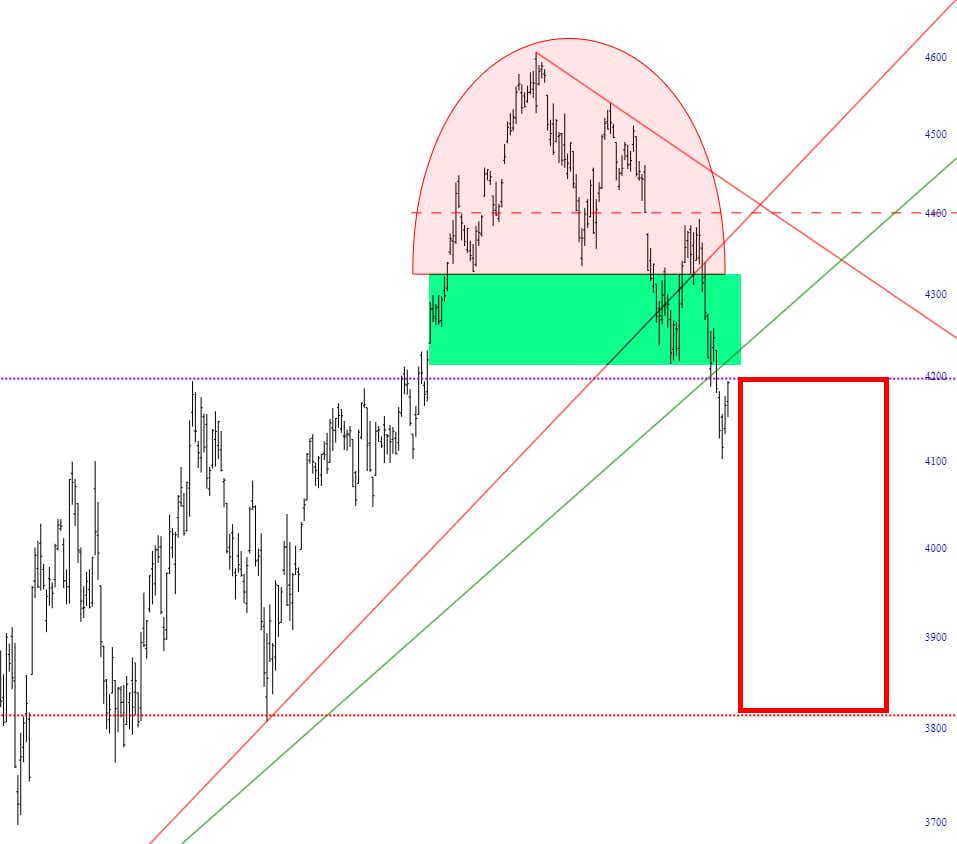
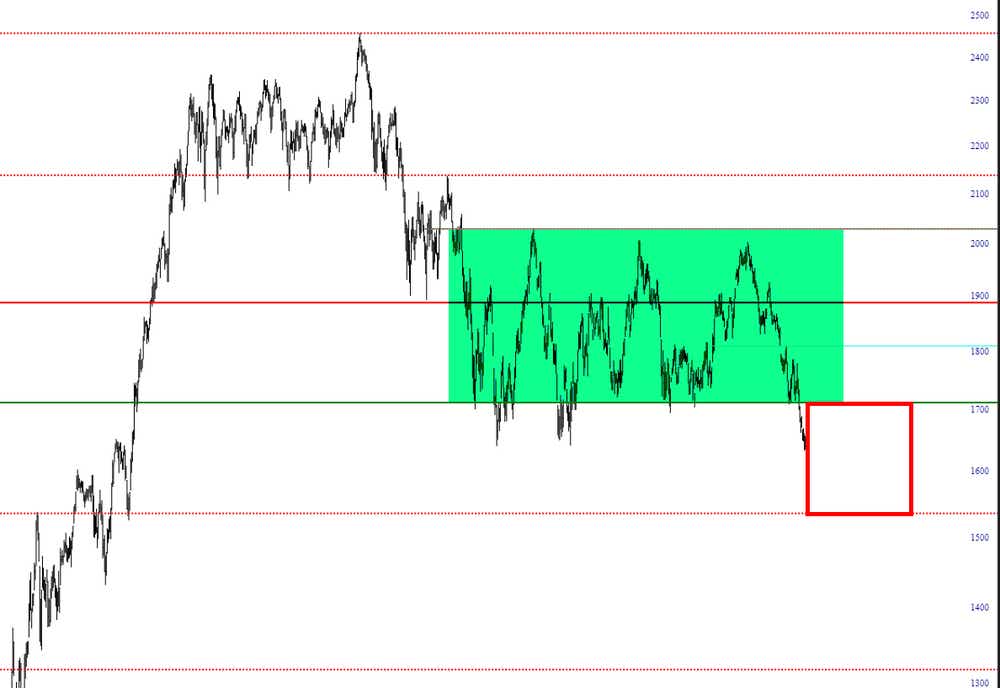
For simplicity's sake, the format of each of the charts below is consistent. Specifically:
- A few basic drawn objects highlight what I consider important patterns and levels of support/resistance;
- Pink semi-circles indicate a boundary for what I consider a reversal pattern;
- A green-tinted area approximates the important overhead supply for any given index and, thus, an area that should resist easy price ascent;
- A red rectangle shows the potential "drop zone" for the balance of the year. To be clear, it's virtually impossible to know what a stock or index is going to do the next day, let alone the next two months, so don’t interpret this red rectangle as a firm prediction. Instead, it represents the prospective risk area through which prices could move, based on an approximate measured move or some meaningful support level beneath price presents.
Having said all that, let's go through the indexes one by one.
S&P 500
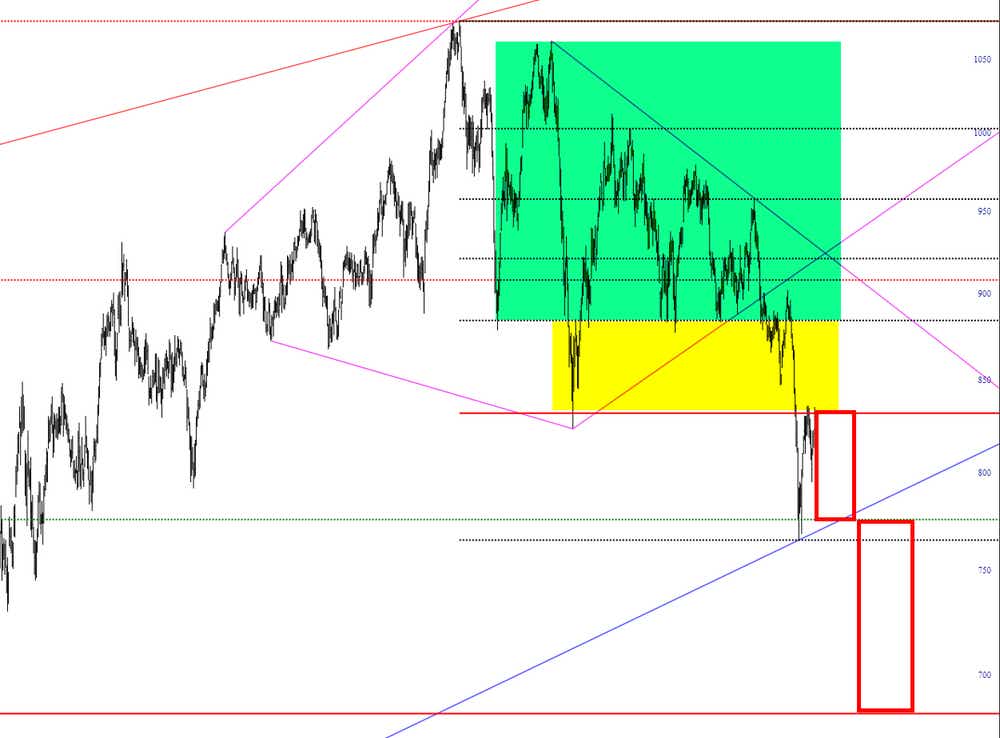
Dow 15 Utilities
Which is the only one with two drop zones and two areas of resistance (one green, one yellow, the latter of which would be easier to penetrate). The smaller, higher one is, by definition, the high-probability one because it is a less dramatic drop. If the UTIL were to cut beneath this region, it would mean that it had broken a multi-decade trendline, and the index (and the market as a whole) might be in for a truly historic plunge.
Major Market Index
The Semiconductor Index
Pretty much at the mercy of Nvidia (NVDA) these days.

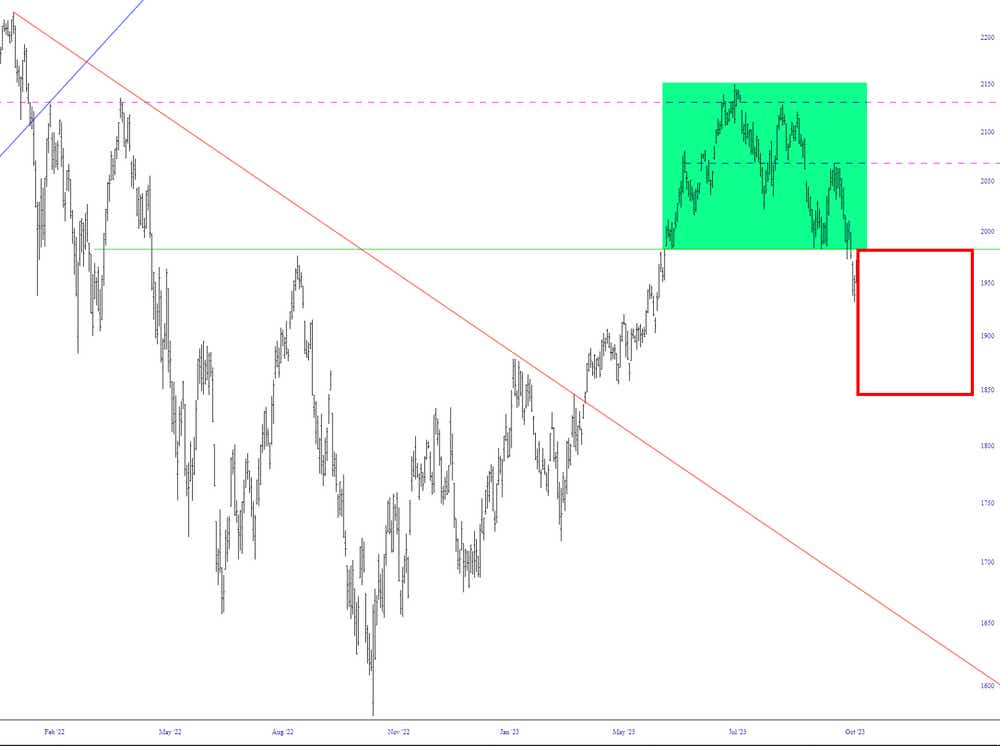
The Russell 2000 index
Range-bound for the past two years but could potentially work its way to its next Fibonacci level lower.
S&P 100 index
NASDAQ 100
Also prospectively heading to its next lower Fibonacci level as major support:
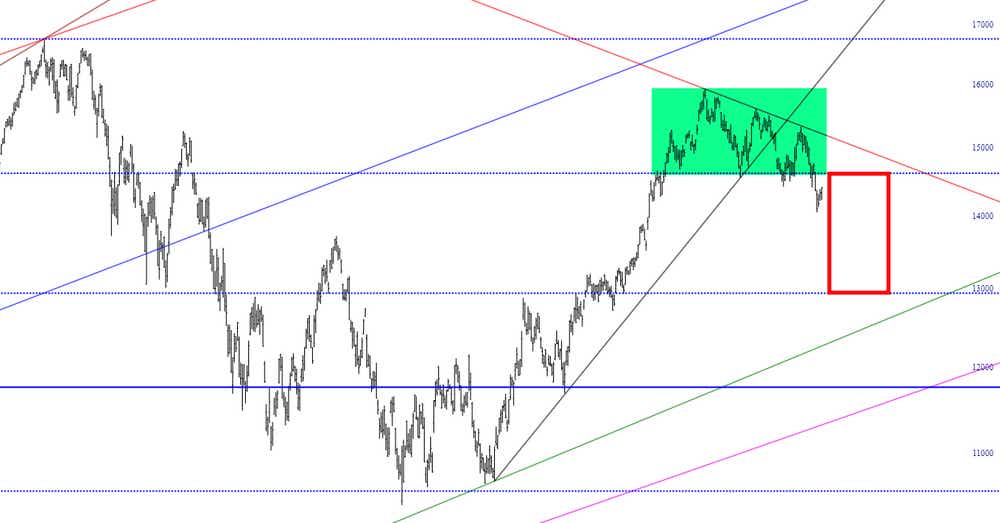
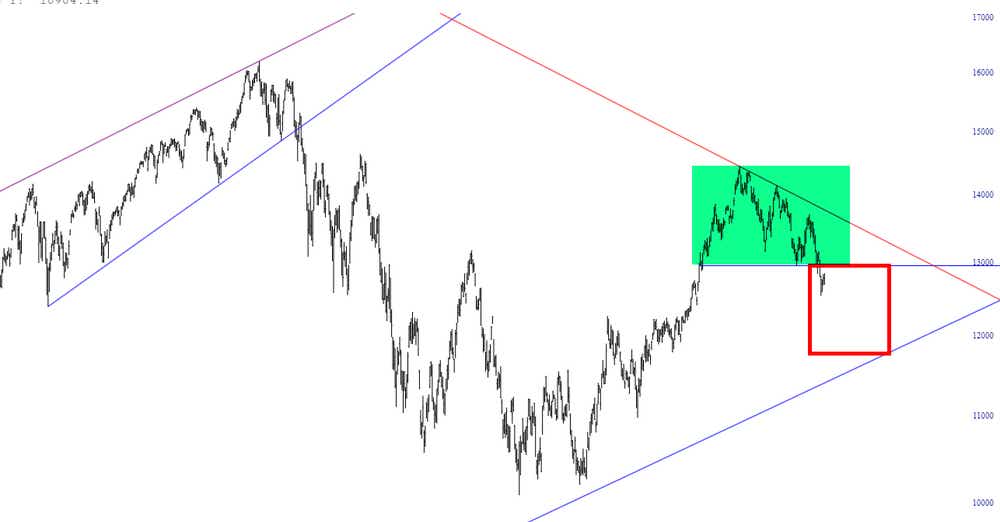
The NASDAQ Composite
Considering the federal government’s tendency to bail out markets that are in trouble, it seems highly likely the scenario suggested by all the red rectangles above would compel it, once again, to plunge the nation into trillions of dollars of debt to stave off further drops in equity prices. Japan has been doing that for decades and, oddly, it seems to have worked so far.
When it stops working—and it seems inevitable that it will one day—the potential repercussions are too staggering to consider.
Tim Knight, a charting analyst with 35 years of trading experience, hosts Trading Charts, a tastylive segment airing Monday-Friday. He founded slopeofhope.com in 2005 and uses it as the basis of his technical charting and analysis. Knight authors The Technician column for Luckbox magazine.
For live daily programming, market news and commentary, visit tastylive or the YouTube channels tastylive (for options traders), and tastyliveTrending for stocks, futures, forex & macro.
Trade with a better broker, open a tastytrade account today. tastylive, Inc. and tastytrade, Inc. are separate but affiliated companies.
Options involve risk and are not suitable for all investors. Please read Characteristics and Risks of Standardized Options before deciding to invest in options.
tastylive content is created, produced, and provided solely by tastylive, Inc. (“tastylive”) and is for informational and educational purposes only. It is not, nor is it intended to be, trading or investment advice or a recommendation that any security, futures contract, digital asset, other product, transaction, or investment strategy is suitable for any person. Trading securities, futures products, and digital assets involve risk and may result in a loss greater than the original amount invested. tastylive, through its content, financial programming or otherwise, does not provide investment or financial advice or make investment recommendations. Investment information provided may not be appropriate for all investors and is provided without respect to individual investor financial sophistication, financial situation, investing time horizon or risk tolerance. tastylive is not in the business of transacting securities trades, nor does it direct client commodity accounts or give commodity trading advice tailored to any particular client’s situation or investment objectives. Supporting documentation for any claims (including claims made on behalf of options programs), comparisons, statistics, or other technical data, if applicable, will be supplied upon request. tastylive is not a licensed financial adviser, registered investment adviser, or a registered broker-dealer. Options, futures, and futures options are not suitable for all investors. Prior to trading securities, options, futures, or futures options, please read the applicable risk disclosures, including, but not limited to, the Characteristics and Risks of Standardized Options Disclosure and the Futures and Exchange-Traded Options Risk Disclosure found on tastytrade.com/disclosures.
tastytrade, Inc. ("tastytrade”) is a registered broker-dealer and member of FINRA, NFA, and SIPC. tastytrade was previously known as tastyworks, Inc. (“tastyworks”). tastytrade offers self-directed brokerage accounts to its customers. tastytrade does not give financial or trading advice, nor does it make investment recommendations. You alone are responsible for making your investment and trading decisions and for evaluating the merits and risks associated with the use of tastytrade’s systems, services or products. tastytrade is a wholly-owned subsidiary of tastylive, Inc.
tastytrade has entered into a Marketing Agreement with tastylive (“Marketing Agent”) whereby tastytrade pays compensation to Marketing Agent to recommend tastytrade’s brokerage services. The existence of this Marketing Agreement should not be deemed as an endorsement or recommendation of Marketing Agent by tastytrade. tastytrade and Marketing Agent are separate entities with their own products and services. tastylive is the parent company of tastytrade.
tastyfx, LLC (“tastyfx”) is a Commodity Futures Trading Commission (“CFTC”) registered Retail Foreign Exchange Dealer (RFED) and Introducing Broker (IB) and Forex Dealer Member (FDM) of the National Futures Association (“NFA”) (NFA ID 0509630). Leveraged trading in foreign currency or off-exchange products on margin carries significant risk and may not be suitable for all investors. We advise you to carefully consider whether trading is appropriate for you based on your personal circumstances as you may lose more than you invest.
tastycrypto is provided solely by tasty Software Solutions, LLC. tasty Software Solutions, LLC is a separate but affiliate company of tastylive, Inc. Neither tastylive nor any of its affiliates are responsible for the products or services provided by tasty Software Solutions, LLC. Cryptocurrency trading is not suitable for all investors due to the number of risks involved. The value of any cryptocurrency, including digital assets pegged to fiat currency, commodities, or any other asset, may go to zero.
© copyright 2013 - 2026 tastylive, Inc. All Rights Reserved. Applicable portions of the Terms of Use on tastylive.com apply. Reproduction, adaptation, distribution, public display, exhibition for profit, or storage in any electronic storage media in whole or in part is prohibited under penalty of law, provided that you may download tastylive’s podcasts as necessary to view for personal use. tastylive was previously known as tastytrade, Inc. tastylive is a trademark/servicemark owned by tastylive, Inc.
Your privacy choices