Technician's Take: Is the Turn Coming for the S&P 500 and Nasdaq 100?

Technician's Take: Is the Turn Coming for the S&P 500 and Nasdaq 100?
Soft U.S. job numbers may be the catalyst
- Both /ESZ3 and /NQZ3 have broken significant multi-month uptrends, yet bears have yet to find any follow-through lower.
- The bond market is basically in charge, as 30s (/ZBZ3) and ultras (/UBZ3) have sold-off meaningfully since the September FOMC meeting.
- Softer U.S. labor market data could be the elixir equities need to begin rallying more significantly.
Market Update: S&P 500 down -0.68% month-to-date
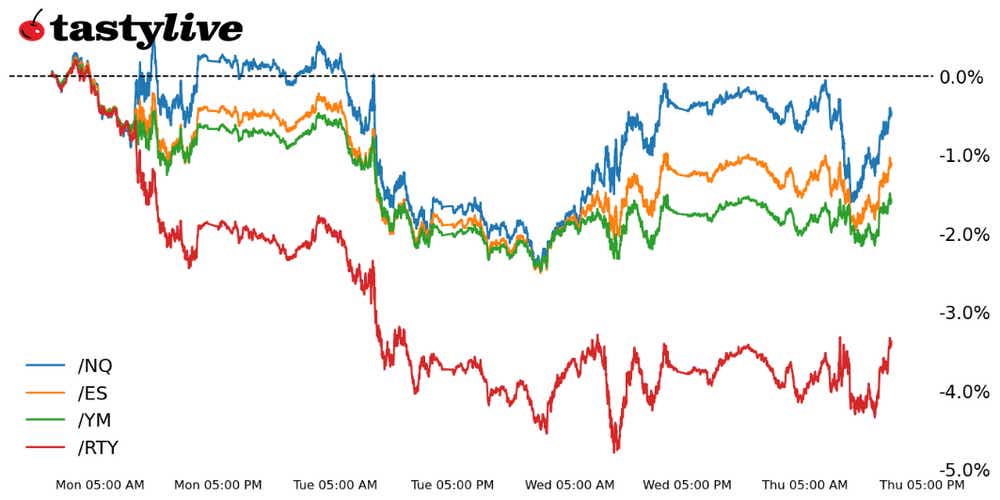
October may be known as “the bear killer,” but thus far it’s been quite the opposite: All four major U.S. equity indexes are down at the start of the month, continuing to follow the bond market lower. In fact, both 30s (/ZBZ3) and ultras (/UBZ3) have rolling one-month correlations of 0.85 or higher with each of the S&P 500 (/ESZ3), the Nasdaq 100 (/NQZ3), the Russell 2000 (/RTYZ3), and the Dow Jones 30 (/YMZ3). The bond market remains the tail that wags the equity market dog.
That said, there may be some early signs that bonds are bottom: the 10-year note (/ZNZ3) is on the verge of posting its first close above its one-week moving average (daily 5-EMA) for the first time since Sept. 13 (neither /ZBZ3 or /UBZ3 are there quite yet, but they’re getting close). Not that the one-week moving average is sacrosanct, but it has been a defining technical characteristic of the downtrend over the past few weeks. In turn, some green shoots are appearing in U.S. equity indexes, suggesting a near-term bottom may be reached soon—particularly if the September U.S. jobs report and inflation report cooperate in the coming days.
/ES S&P 500 Price Technical Analysis: Daily Chart (September 2022 to September 2023)
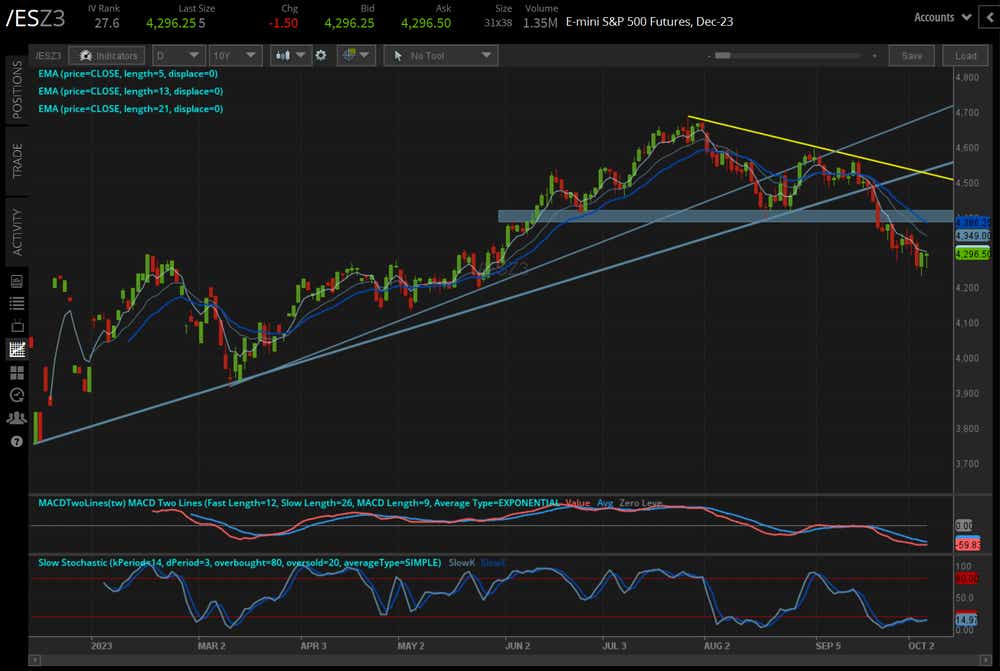
/ESZ3’s decline has stalled at the June lows. Momentum is starting to lose its bearish hue as well. /ESZ3’s daily 5-, 13- and 21-EMA envelope remains in bearish sequential order, but a close above the daily 5-EMA would be the first since Sept. 14. MACD’s descent below its signal line is slowing, and Slow Stochastics are nearing an exit from oversold territory.
It’s too soon to get bulled up, but it won’t take much more from here to provide a technical impetus to take advantage of the relatively higher volatility environment and begin looking at selling puts as a way to take advantage of a turn higher.
/NQ Nasdaq 100 Price Technical Analysis: Daily Chart (December 2022 to September 2023)
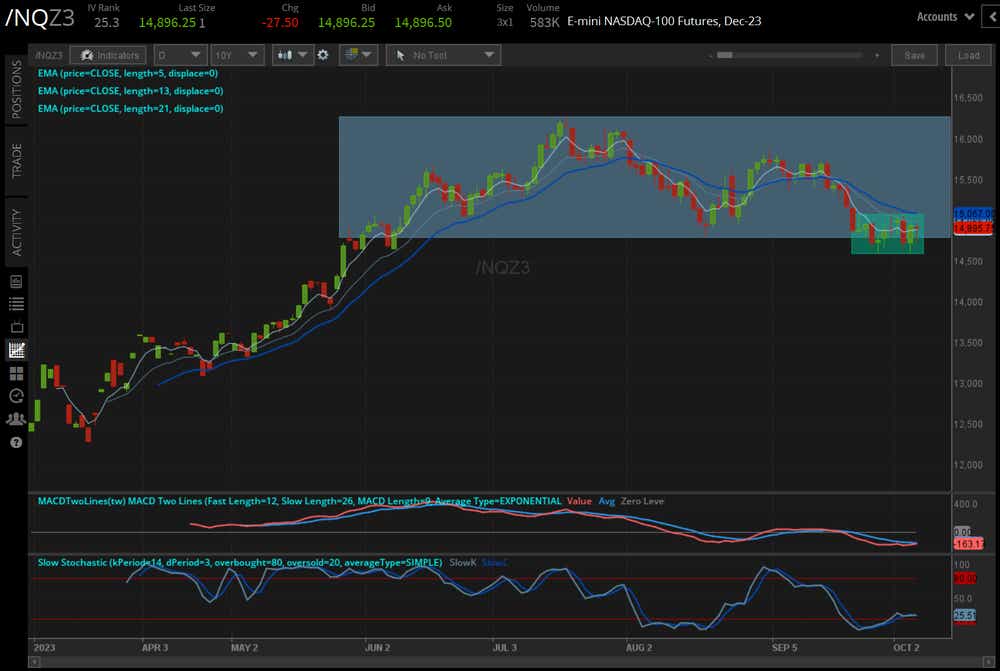
/NQZ3 has been resilient while other index futures have suffered; the tech-heavy index has carved out a range over the past 10 days around 14600/15100. A short-term double bottom may be coming together near the August low, which would point to an upside target just north of 15600. If this were accomplished, then the trendline from the January and March swing lows would be retaken.
Intertwined among its daily EMA (exponential moving average) envelope, /NQZ3 has already broken its bearish momentum as MACD (moving average convergence divergence) is close to issuing a bullish crossover (albeit in bearish territory) while Slow Stochastics have exited oversold territory.
/RTY Russell 2000 Price Technical Analysis: Daily Chart (April 2023 to September 2023)
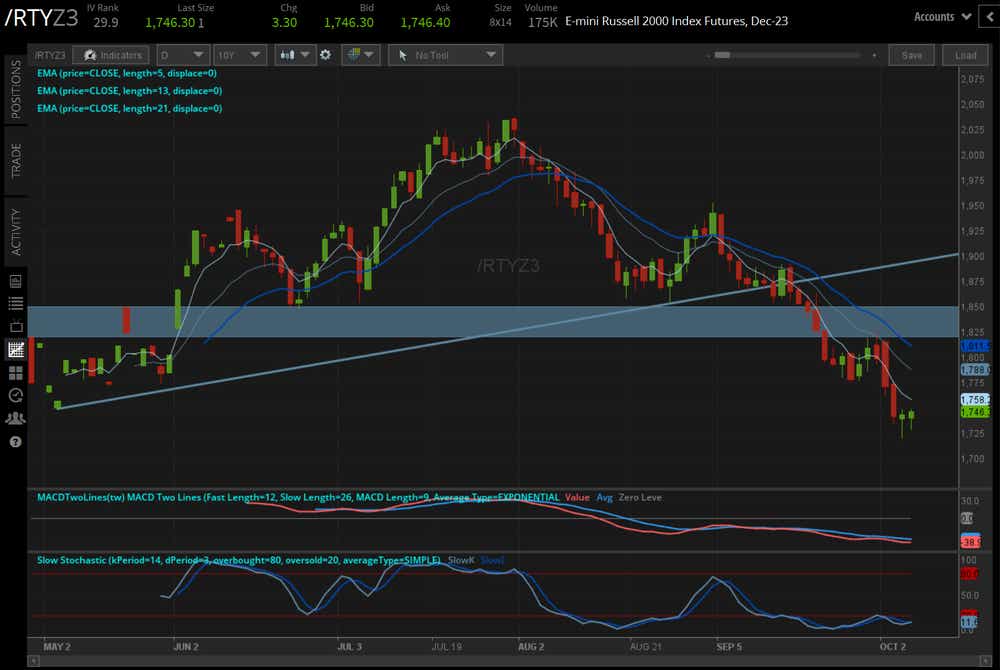
We've been noting for a few weeks that “the technical outlook for /RTYZ3 is easily the most disconcerting … with regional banks leading lower amid a push higher in U.S. Treasury yields, a return to /RTYZ3’s yearly low at 1750 is in the cards.” /RTYZ3 was last seen at 1746.3, vindicating the prior technical view. While there isn’t much here to suggest a low is in place, any semblance of basing in /RTYZ3 might be enough to give /ESZ3 and /NQZ3 the confidence to try and break out higher in the short term.
Christopher Vecchio, CFA, tastylive’s head of futures and forex, has been trading for nearly 20 years. He has consulted with multinational firms on FX hedging and lectured at Duke Law School on FX derivatives. Vecchio searches for high-convexity opportunities at the crossroads of macroeconomics and global politics. He hosts Futures Power Hour Monday-Friday and Let Me Explain on Tuesdays, and co-hosts Overtime, Monday-Thursday. @cvecchiofx
For live daily programming, market news and commentary, visit tastylive or the YouTube channels tastylive (for options traders), and tastyliveTrending for stocks, futures, forex & macro.
Trade with a better broker, open a tastytrade account today. tastylive, Inc. and tastytrade, Inc. are separate but affiliated companies.
Options involve risk and are not suitable for all investors. Please read Characteristics and Risks of Standardized Options before deciding to invest in options.
tastylive content is created, produced, and provided solely by tastylive, Inc. (“tastylive”) and is for informational and educational purposes only. It is not, nor is it intended to be, trading or investment advice or a recommendation that any security, futures contract, digital asset, other product, transaction, or investment strategy is suitable for any person. Trading securities, futures products, and digital assets involve risk and may result in a loss greater than the original amount invested. tastylive, through its content, financial programming or otherwise, does not provide investment or financial advice or make investment recommendations. Investment information provided may not be appropriate for all investors and is provided without respect to individual investor financial sophistication, financial situation, investing time horizon or risk tolerance. tastylive is not in the business of transacting securities trades, nor does it direct client commodity accounts or give commodity trading advice tailored to any particular client’s situation or investment objectives. Supporting documentation for any claims (including claims made on behalf of options programs), comparisons, statistics, or other technical data, if applicable, will be supplied upon request. tastylive is not a licensed financial adviser, registered investment adviser, or a registered broker-dealer. Options, futures, and futures options are not suitable for all investors. Prior to trading securities, options, futures, or futures options, please read the applicable risk disclosures, including, but not limited to, the Characteristics and Risks of Standardized Options Disclosure and the Futures and Exchange-Traded Options Risk Disclosure found on tastytrade.com/disclosures.
tastytrade, Inc. ("tastytrade”) is a registered broker-dealer and member of FINRA, NFA, and SIPC. tastytrade was previously known as tastyworks, Inc. (“tastyworks”). tastytrade offers self-directed brokerage accounts to its customers. tastytrade does not give financial or trading advice, nor does it make investment recommendations. You alone are responsible for making your investment and trading decisions and for evaluating the merits and risks associated with the use of tastytrade’s systems, services or products. tastytrade is a wholly-owned subsidiary of tastylive, Inc.
tastytrade has entered into a Marketing Agreement with tastylive (“Marketing Agent”) whereby tastytrade pays compensation to Marketing Agent to recommend tastytrade’s brokerage services. The existence of this Marketing Agreement should not be deemed as an endorsement or recommendation of Marketing Agent by tastytrade. tastytrade and Marketing Agent are separate entities with their own products and services. tastylive is the parent company of tastytrade.
tastyfx, LLC (“tastyfx”) is a Commodity Futures Trading Commission (“CFTC”) registered Retail Foreign Exchange Dealer (RFED) and Introducing Broker (IB) and Forex Dealer Member (FDM) of the National Futures Association (“NFA”) (NFA ID 0509630). Leveraged trading in foreign currency or off-exchange products on margin carries significant risk and may not be suitable for all investors. We advise you to carefully consider whether trading is appropriate for you based on your personal circumstances as you may lose more than you invest.
tastycrypto is provided solely by tasty Software Solutions, LLC. tasty Software Solutions, LLC is a separate but affiliate company of tastylive, Inc. Neither tastylive nor any of its affiliates are responsible for the products or services provided by tasty Software Solutions, LLC. Cryptocurrency trading is not suitable for all investors due to the number of risks involved. The value of any cryptocurrency, including digital assets pegged to fiat currency, commodities, or any other asset, may go to zero.
© copyright 2013 - 2026 tastylive, Inc. All Rights Reserved. Applicable portions of the Terms of Use on tastylive.com apply. Reproduction, adaptation, distribution, public display, exhibition for profit, or storage in any electronic storage media in whole or in part is prohibited under penalty of law, provided that you may download tastylive’s podcasts as necessary to view for personal use. tastylive was previously known as tastytrade, Inc. tastylive is a trademark/servicemark owned by tastylive, Inc.
Your privacy choices