S&P 500, Nasdaq 100 Hold Key Support

S&P 500, Nasdaq 100 Hold Key Support
Traders seem more optimistic today after seeing the string of gains broken last week
- U.S. stock markets started the year off by ending their winning streak of nine consecutive weeks of gains.
- However, technical signs are emerging that both the S&P 500 (/ESH4) and Nasdaq 100 (/NQH4) are basing at key near-term support.
- The Russell 2000’s (/RTYH4) technical picture is a bit more muddled.

Market update: S&P 500 down 1.12% month-to-date
2024 has started in a disappointing manner, but traders are taking a more optimistic approach in the second week of the year. Three of the four major U.S. indexes are trading in the green today, continuing the rebound off the pre-jobs report lows of last week. In particular, both the S&P 500 (/ESH4) and Nasdaq 100 (/NQH4) have turned the July 2023 high into support, suggesting the multi-month uptrend of higher highs and higher lows remains intact.
Outside of the December U.S. inflation report on Thursday, it’s a quiet macroeconomic calendar in the coming days, while earnings season begins in earnest with banks reporting at the end of the week. Until then, a few obstacles are preventing the nascent rebound from continuing.
/ES S&P 500 Price Technical Analysis: Daily Chart (April 2023 to January 2024)

The S&P 500 (/ESH4) has staged an important technical reversal higher in recent sessions. Friday’s doji candlestick at the bottom of a downtrend has been greeted by a bullish piercing candle today, all while turning back above the daily 21-EMA (one-month exponential average) and the July 2023, around 4738/45. While momentum is not uniformly bullish, it’s worth noting the divergence in slow stochastics and MACD (moving average convergence/divergence indicator) cater to a bullish resolution. Although volatility is unimpressive (IV Index: 13.2%; IV Rank: 10.8), selling put spreads around last week’s low may prove to be a viable short-term approach.
/NQ Nasdaq 100 Price Technical Analysis: Daily Chart (June 2023 to January 2024)

The setup in the Nasdaq 100 (/NQH4) is cleaner than in /ESH4. The July and November 2023 swing highs near 14400 have held as support in recent days, with a morning star candlestick pattern (bullish bottoming signal) forming at the former key resistance level from last year. /NQH4 is also reestablishing itself above its daily 21-EMA. Slow stochastics have issued a buy signal after having exited oversold territory; the divergence in both slow stochastics and MACD points to a rebound in the short-term. Like in /ESH4, selling put spreads in /NQH4 around last week’s low may prove to be a viable option for the coming days.
/RTY Russell 2000 Price Technical Analysis: Daily Chart (July 2023 to January 2024)
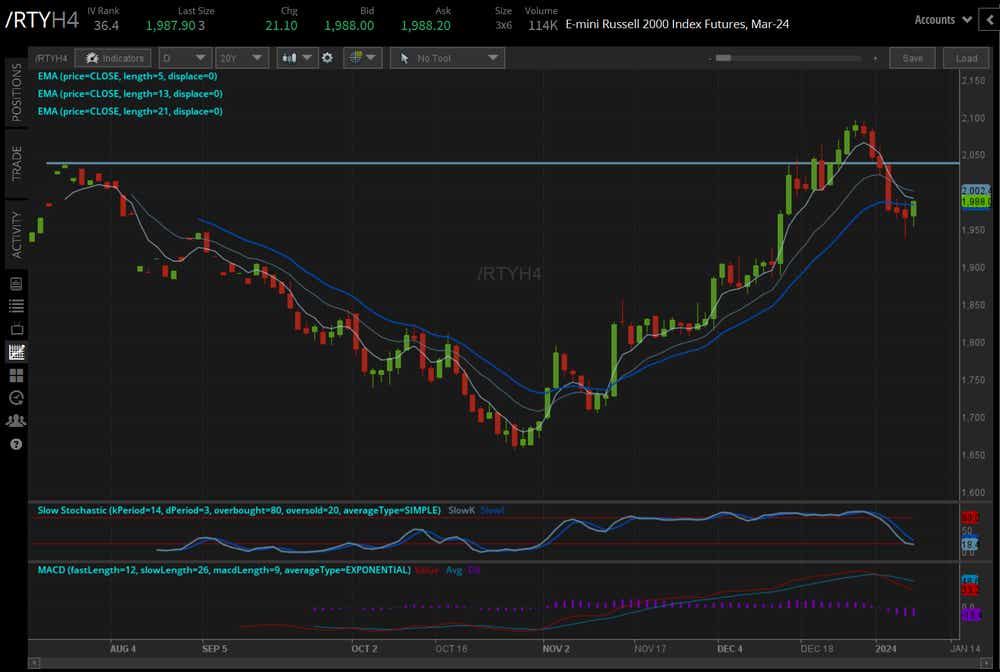
The Russell 2000 (/RTYH4) has been the weakest major index at the start of the year, although it’s trying to make up some of that difference today. The key difference between /RTYH4 and /ESH4 and /NQH4 is that the former one has been summarily rejected in attempting to break through multi-year range resistance, while the latter two have merely eased back after hitting all-time highs at the end of December. There’s more work to be done for /RTYH4 to have a cleaner technical setup, but one additional fact remains: /RTYH4 is more appealing for options traders (IV Index: 22.5%; IV Rank: 36.5) than any of the other major indexes.
Christopher Vecchio, CFA, tastylive’s head of futures and forex, has been trading for nearly 20 years. He has consulted with multinational firms on FX hedging and lectured at Duke Law School on FX derivatives. Vecchio searches for high-convexity opportunities at the crossroads of macroeconomics and global politics. He hosts Futures Power Hour Monday-Friday and Let Me Explain on Tuesdays, and co-hosts Overtime, Monday-Thursday. @cvecchiofx
For live daily programming, market news and commentary, visit tastylive or the YouTube channels tastylive (for options traders), and tastyliveTrending for stocks, futures, forex & macro.
Trade with a better broker, open a tastytrade account today. tastylive, Inc. and tastytrade, Inc. are separate but affiliated companies.
Options involve risk and are not suitable for all investors. Please read Characteristics and Risks of Standardized Options before deciding to invest in options.
tastylive content is created, produced, and provided solely by tastylive, Inc. (“tastylive”) and is for informational and educational purposes only. It is not, nor is it intended to be, trading or investment advice or a recommendation that any security, futures contract, digital asset, other product, transaction, or investment strategy is suitable for any person. Trading securities, futures products, and digital assets involve risk and may result in a loss greater than the original amount invested. tastylive, through its content, financial programming or otherwise, does not provide investment or financial advice or make investment recommendations. Investment information provided may not be appropriate for all investors and is provided without respect to individual investor financial sophistication, financial situation, investing time horizon or risk tolerance. tastylive is not in the business of transacting securities trades, nor does it direct client commodity accounts or give commodity trading advice tailored to any particular client’s situation or investment objectives. Supporting documentation for any claims (including claims made on behalf of options programs), comparisons, statistics, or other technical data, if applicable, will be supplied upon request. tastylive is not a licensed financial adviser, registered investment adviser, or a registered broker-dealer. Options, futures, and futures options are not suitable for all investors. Prior to trading securities, options, futures, or futures options, please read the applicable risk disclosures, including, but not limited to, the Characteristics and Risks of Standardized Options Disclosure and the Futures and Exchange-Traded Options Risk Disclosure found on tastytrade.com/disclosures.
tastytrade, Inc. ("tastytrade”) is a registered broker-dealer and member of FINRA, NFA, and SIPC. tastytrade was previously known as tastyworks, Inc. (“tastyworks”). tastytrade offers self-directed brokerage accounts to its customers. tastytrade does not give financial or trading advice, nor does it make investment recommendations. You alone are responsible for making your investment and trading decisions and for evaluating the merits and risks associated with the use of tastytrade’s systems, services or products. tastytrade is a wholly-owned subsidiary of tastylive, Inc.
tastytrade has entered into a Marketing Agreement with tastylive (“Marketing Agent”) whereby tastytrade pays compensation to Marketing Agent to recommend tastytrade’s brokerage services. The existence of this Marketing Agreement should not be deemed as an endorsement or recommendation of Marketing Agent by tastytrade. tastytrade and Marketing Agent are separate entities with their own products and services. tastylive is the parent company of tastytrade.
tastyfx, LLC (“tastyfx”) is a Commodity Futures Trading Commission (“CFTC”) registered Retail Foreign Exchange Dealer (RFED) and Introducing Broker (IB) and Forex Dealer Member (FDM) of the National Futures Association (“NFA”) (NFA ID 0509630). Leveraged trading in foreign currency or off-exchange products on margin carries significant risk and may not be suitable for all investors. We advise you to carefully consider whether trading is appropriate for you based on your personal circumstances as you may lose more than you invest.
tastycrypto is provided solely by tasty Software Solutions, LLC. tasty Software Solutions, LLC is a separate but affiliate company of tastylive, Inc. Neither tastylive nor any of its affiliates are responsible for the products or services provided by tasty Software Solutions, LLC. Cryptocurrency trading is not suitable for all investors due to the number of risks involved. The value of any cryptocurrency, including digital assets pegged to fiat currency, commodities, or any other asset, may go to zero.
© copyright 2013 - 2026 tastylive, Inc. All Rights Reserved. Applicable portions of the Terms of Use on tastylive.com apply. Reproduction, adaptation, distribution, public display, exhibition for profit, or storage in any electronic storage media in whole or in part is prohibited under penalty of law, provided that you may download tastylive’s podcasts as necessary to view for personal use. tastylive was previously known as tastytrade, Inc. tastylive is a trademark/servicemark owned by tastylive, Inc.
Your privacy choices