Off the Charts: Chinese Equity Flows, Yen Volatility, U.S. Home Prices & Affordability, and Rising Fed Cut Odds

Off the Charts: Chinese Equity Flows, Yen Volatility, U.S. Home Prices & Affordability, and Rising Fed Cut Odds
The S&P 500 is up 1.73% for the month to date
Each week, buy-side and sell-side analysts produce reams of charts and data visualizations to help contextualize price action across asset classes.
These data can help shape one’s thinking, offering evidence for increased conviction or criticism about currently held beliefs. Likewise, they may offer insight into relative risk/reward opportunities in various markets. These are the five charts that had an impact on my views on markets this week.
1) Not just short covering: The Chinese equity rally is for real

Trade implications: Chinese equities have been on fire in recent weeks, with FXI, the iShares China Large-Cap ETF, now up 13.73% for the year to date and 31.02% higher than its 2024 lows.
Data from Goldman Sachs’ flows desk shows that demand for local equities (A-Share and H-Share) have been increasing since late-January, while gross long and net overall trading flows for Chinese equities has been positive for that duration as well.
This underscores the fact that the rally by FXI (and Chinese stocks broadly) has not been a short-covering rally, but instead one driven by real belief in continued upside.
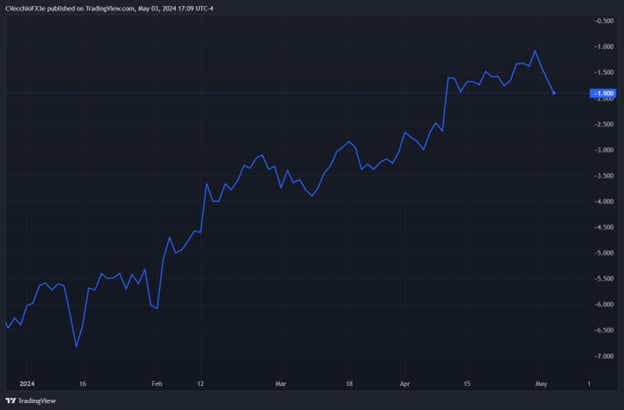
2) Yentervention efforts may succeed, for now

Takeaways: From Simon White, macro strategist at Bloomberg:“The carry trade depends on rate differentials. Traders borrow the yen, swap it for dollars, i.e., buy USD/JPY, then use the proceeds to buy a US asset, such as T-bills or Treasuries. But that leaves them long USD/JPY and therefore exposed to falls. A big enough move in spot could wipe out the profit from the U.S. versus Japanese rate spread ... That’s why the volatility of the currency matters to carry traders. If it is too high, then the trade becomes too risky. Adjusting the US-Japan real rate differential for USD/JPY volatility shows the measure is still high, but it is beginning to fall. The more vol rises, the more it will keep falling (other things equal).”
Trade implications: The Bank of Japan and Japanese Ministry of Finance introduced volatility to FX markets this week with not one but two different interventions to prevent USD/JPY spot rates from crossing above the 1990 high at 160.40 (the rally halted at 160.22). Now that oil prices have started to pullback and U.S. Treasury yields have moved lower, Japanese officials may continue to try to press their luck with the wind at their back. Earlier this week, when asked about intervention details, a Japanese official noted that the information would be released at the end of May; reading between the lines, it’s a sign that intervention efforts may not be done, and they want to keep speculators at bay.
3) U.S. national home prices are seeing the fastest growth in years
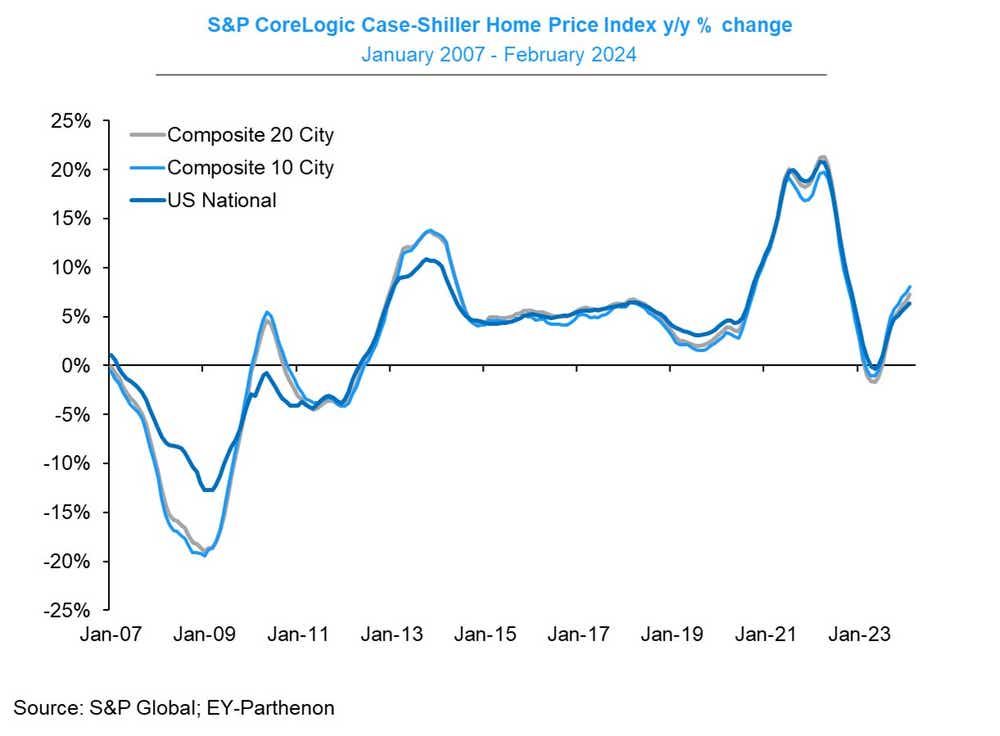
Takeaways: The S&P CoreLogic Case-Shiller 20-city national home price index increased by +0.9% month over month in February 2024, the fastest month-over-month growth rate since June 2023. Similarly, prices were up 7.3% year over year, the fastest year-over-year growth rate since October 2022.
Trade implications: Limited construction of new housing and high mortgage rates weighing on demand have exacerbated the supply issue plaguing the U.S. housing market since the Great Recession.
While bad for prospective home buyers (more on that below), this has been a favorable mix for homebuilders. ITB, the iShares U.S. Home Construction ETF, is up 3.39% for the month to date, nearly doubling the performance of the S&P 500. ITB was a market leader in 2023, gaining 67.86%, outpacing the vaunted semiconductor sector along the way. If U.S. Treasury yields have found a temporary top, a retrenchment in mortgage rates could be a meaningful tailwind for ITB as it seeks to regain its place among market leadership.
4) Rising prices are not the only issue affecting house affordability
_YoY_(2.6_)_MoM_when_mortgage_rates_were_rising.jpeg?format=pjpg&auto=webp&quality=50&width=1000&disable=upscale)
Takeaways: From BofA Global Research: “The Housing Affordability Index was reported by National Association of Realtors (NAR) at 103.0 in February, tracking at (26%) below the historical average of 138.3.”
Trade implications: Rising home prices (as covered above) may be a downstream effect of the lack of affordable housing in the U.S. The vast majority (~95%) of U.S. homeowners with mortgages have fixed rate mortgages, with the average rate locked in below 4%. With mortgage rates hovering near 7%, there is little incentive to sell one’s home if it has a lower mortgage rate or no mortgage at all.
Incidentally, this leads one down the Erdoganian path to believing that the cure for higher prices isn’t higher rates but instead lower rates, as a drop in mortgage rates would allow the housing market to clear and find a proper equilibrium.
Taken a step further, it would also mean that the Federal Reserve’s rate hikes are one of the root causes of inflation staying elevated–after all, shelter price measures are sticky and lagged. And the combination of high mortgage rates and limited construction creates a supply squeeze that keeps shelter prices elevated.
All that leads to the conclusion that the Fed won’t cut rates until housing prices relent, and housing prices won’t relent (and affordability won’t improve) until the Fed cuts rates. That's a real chicken or the egg scenario! As for the trade: it means higher for longer, and any drop in bond yields should prove temporary.
5) Fed cut odds retracement may be finished
Trade implications: Fed Chair Jerome Powell, at the May FOMC meeting press conference, made clear that the bar for a rate hike is exceptionally high. Markets took this as a sign that the Fed only has two choices in front of it: hold or cut.
The resurgence in rate cut odds this week has been a tailwind for the bond market, but it may be temporary. Looking at the calendar, two cuts (barring a crisis) seem to be the absolute maximum plausible for 2024. To this end, if markets price in more than two cuts, that means that there is premium in the /SR3M4 and /SR3U4 contracts that must be eliminated prior to expiration. Given the tight relationship between bonds across the curve and rate cut odds, it makes sense that the erosion of cut odds in June and July will act as a proverbial albatross around bonds’ necks. Near-term strength in bonds may look to be sold here henceforth.
Christopher Vecchio, CFA, tastylive’s head of futures and forex, has been trading for nearly 20 years. He has consulted with multinational firms on FX hedging and lectured at Duke Law School on FX derivatives. Vecchio searches for high-convexity opportunities at the crossroads of macroeconomics and global politics. He hosts Futures Power Hour Monday-Friday and Let Me Explain on Tuesdays, and co-hosts Overtime, Monday-Thursday. @cvecchiofx
For live daily programming, market news and commentary, visit tastylive or the YouTube channels tastylive (for options traders), and tastyliveTrending for stocks, futures, forex & macro.
Trade with a better broker, open a tastytrade account today. tastylive, Inc. and tastytrade, Inc. are separate but affiliated companies.
Options involve risk and are not suitable for all investors. Please read Characteristics and Risks of Standardized Options before deciding to invest in options.
tastylive content is created, produced, and provided solely by tastylive, Inc. (“tastylive”) and is for informational and educational purposes only. It is not, nor is it intended to be, trading or investment advice or a recommendation that any security, futures contract, digital asset, other product, transaction, or investment strategy is suitable for any person. Trading securities, futures products, and digital assets involve risk and may result in a loss greater than the original amount invested. tastylive, through its content, financial programming or otherwise, does not provide investment or financial advice or make investment recommendations. Investment information provided may not be appropriate for all investors and is provided without respect to individual investor financial sophistication, financial situation, investing time horizon or risk tolerance. tastylive is not in the business of transacting securities trades, nor does it direct client commodity accounts or give commodity trading advice tailored to any particular client’s situation or investment objectives. Supporting documentation for any claims (including claims made on behalf of options programs), comparisons, statistics, or other technical data, if applicable, will be supplied upon request. tastylive is not a licensed financial adviser, registered investment adviser, or a registered broker-dealer. Options, futures, and futures options are not suitable for all investors. Prior to trading securities, options, futures, or futures options, please read the applicable risk disclosures, including, but not limited to, the Characteristics and Risks of Standardized Options Disclosure and the Futures and Exchange-Traded Options Risk Disclosure found on tastytrade.com/disclosures.
tastytrade, Inc. ("tastytrade”) is a registered broker-dealer and member of FINRA, NFA, and SIPC. tastytrade was previously known as tastyworks, Inc. (“tastyworks”). tastytrade offers self-directed brokerage accounts to its customers. tastytrade does not give financial or trading advice, nor does it make investment recommendations. You alone are responsible for making your investment and trading decisions and for evaluating the merits and risks associated with the use of tastytrade’s systems, services or products. tastytrade is a wholly-owned subsidiary of tastylive, Inc.
tastytrade has entered into a Marketing Agreement with tastylive (“Marketing Agent”) whereby tastytrade pays compensation to Marketing Agent to recommend tastytrade’s brokerage services. The existence of this Marketing Agreement should not be deemed as an endorsement or recommendation of Marketing Agent by tastytrade. tastytrade and Marketing Agent are separate entities with their own products and services. tastylive is the parent company of tastytrade.
tastyfx, LLC (“tastyfx”) is a Commodity Futures Trading Commission (“CFTC”) registered Retail Foreign Exchange Dealer (RFED) and Introducing Broker (IB) and Forex Dealer Member (FDM) of the National Futures Association (“NFA”) (NFA ID 0509630). Leveraged trading in foreign currency or off-exchange products on margin carries significant risk and may not be suitable for all investors. We advise you to carefully consider whether trading is appropriate for you based on your personal circumstances as you may lose more than you invest.
tastycrypto is provided solely by tasty Software Solutions, LLC. tasty Software Solutions, LLC is a separate but affiliate company of tastylive, Inc. Neither tastylive nor any of its affiliates are responsible for the products or services provided by tasty Software Solutions, LLC. Cryptocurrency trading is not suitable for all investors due to the number of risks involved. The value of any cryptocurrency, including digital assets pegged to fiat currency, commodities, or any other asset, may go to zero.
© copyright 2013 - 2026 tastylive, Inc. All Rights Reserved. Applicable portions of the Terms of Use on tastylive.com apply. Reproduction, adaptation, distribution, public display, exhibition for profit, or storage in any electronic storage media in whole or in part is prohibited under penalty of law, provided that you may download tastylive’s podcasts as necessary to view for personal use. tastylive was previously known as tastytrade, Inc. tastylive is a trademark/servicemark owned by tastylive, Inc.
Your privacy choices