Crude Oil Price Forecast: Triangle Breakout Lacks Momentum - What's Next?

Crude Oil Price Forecast: Triangle Breakout Lacks Momentum - What's Next?
US Supply Up, OPEC+ Down
With the Russian invasion of Ukraine on the cusp of entering its third month, energy markets have endured another wave of increased volatility. But the news flow around oil has been conflicting to say the least, and it may be a bad omen for crude oil prices that it has not been able to sustain a rally on the back of not only a technical breakout, but signs that oil supply is coming in lower than previous estimates.
While in recent weeks news has emerged that the US has increased its oil production and supplies available to the market, yesterday’s and today’s decline in crude oil prices has been marked by what should have been a bullish catalyst: OPEC+ produced less oil in March than expected. Failure by oil prices to rebound amid news of weaker supply suggests that the recent bullish breakout attempt may fail, setting up a return to the recent lows established at the start of April.
Oil Volatility, Oil Price Correlation Whipsaws
Crude oil prices have a relationship with volatility like most other asset classes, especially those that have real economic uses – other energy assets, soft and hard metals, for example. Similar to how bonds and stocks don’t like increased volatility – signaling greater uncertainty around cash flows, dividends, coupon payments, etc. – crude oil tends to suffer during periods of higher volatility. However, in an environment characterized by geopolitical tensions, crude oil prices continue to broadly follow movements in oil volatility.
OVX (OIL VOLATILITY) TECHNICAL ANALYSIS: DAILY PRICE CHART (APRIL 2021 TO APRIL 2022) (CHART 1)
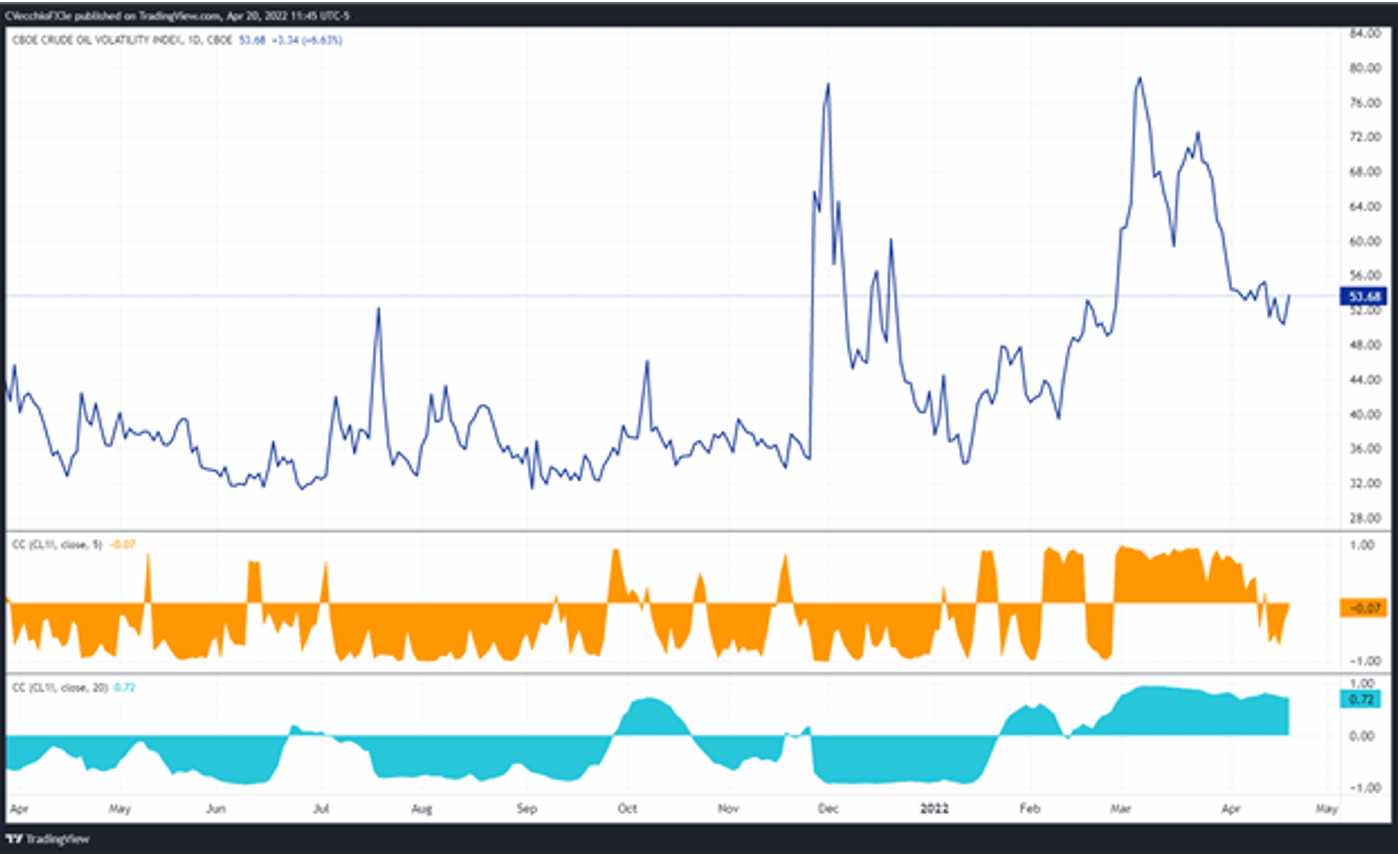
Oil volatility (as measured by the Cboe’s gold volatility ETF, OVX, which tracks the 1-month implied volatility of oil as derived from the USO option chain) was trading at 53.68 at the time this report was written, having recently rebounded from its lowest levels since late-February. The 5-day correlation between OVX and crude oil prices is -0.07 while the 20-day correlation is +0.72. One week ago, on April 13, the 5-day correlation was -0.67 and the 20-day correlation was +0.79.
CRUDE OIL PRICE TECHNICAL ANALYSIS: DAILY CHART (OCTOBER 2020 TO APRIL 2022) (CHART 2)
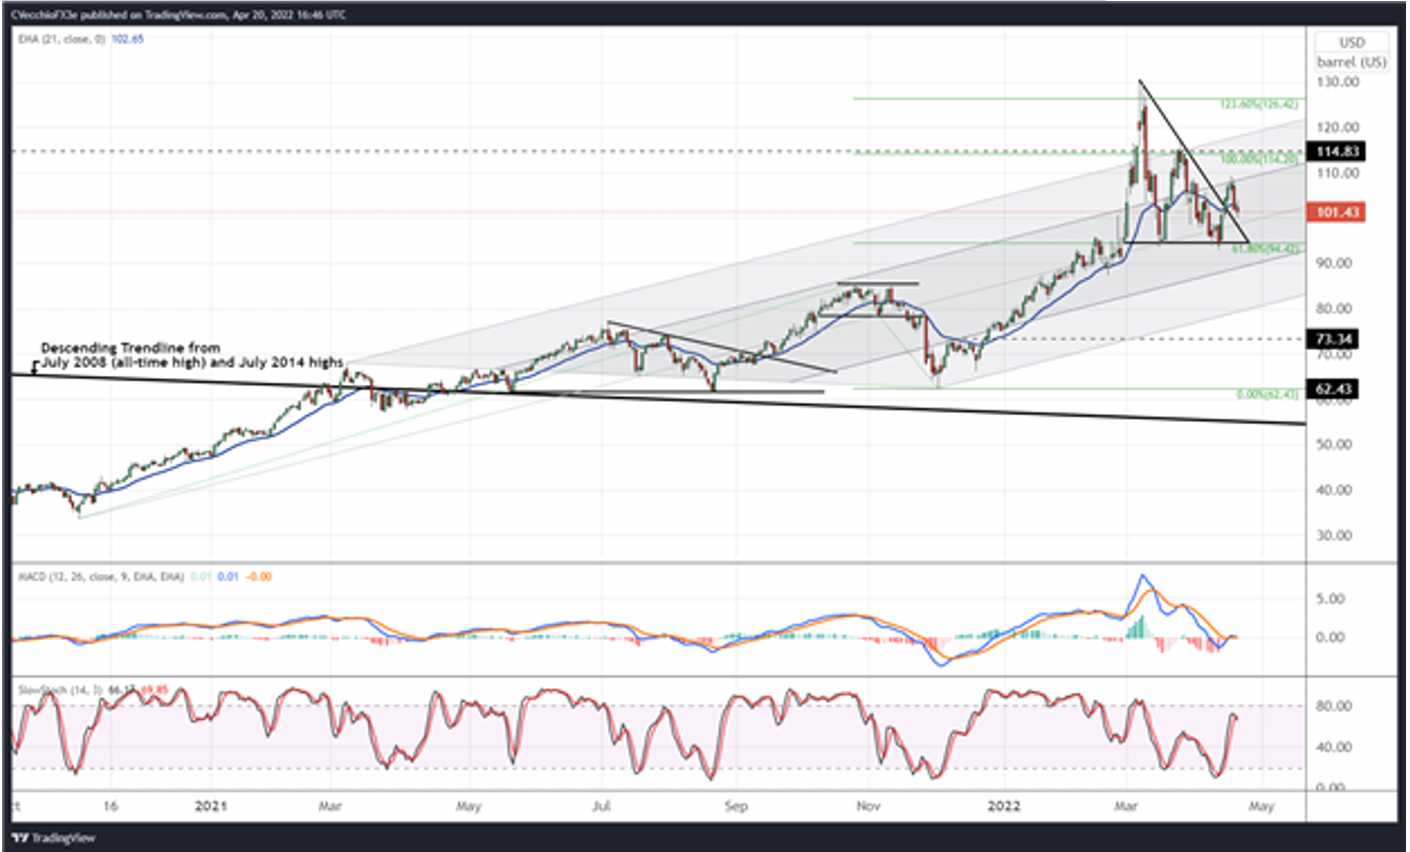
A reconstituted triangle pattern suggests that crude oil prices are seeing meager bullish momentum after a topside breakout last week. While not textbook, a potential evening star candlestick pattern emerged between Friday and Tuesday, indicating that the bullish breakout effort will fail. But for a few days in early-March, crude oil prices have largely remained between the 61.8% and 100% Fibonacci extension levels measured from the November 2020 low, October 2021 high, and December 2021.
Bearish momentum is beginning to set back in, oil prices below their daily 5-, 8-, 13-, and 21-EMA envelope (which is not yet in bearish sequential order). Daily MACD is on the verge of dropping below its signal line, while daily Slow Stochastics failed to reach overbought territory and are turning lower. A move back towards recent lows near 94.42 (61.8% Fibonacci extension of the aforementioned measurement) is possible in the near-term.
CRUDE OIL PRICE TECHNICAL ANALYSIS: WEEKLY CHART (MARCH 2008 TO APRIL 2022) (CHART 3)
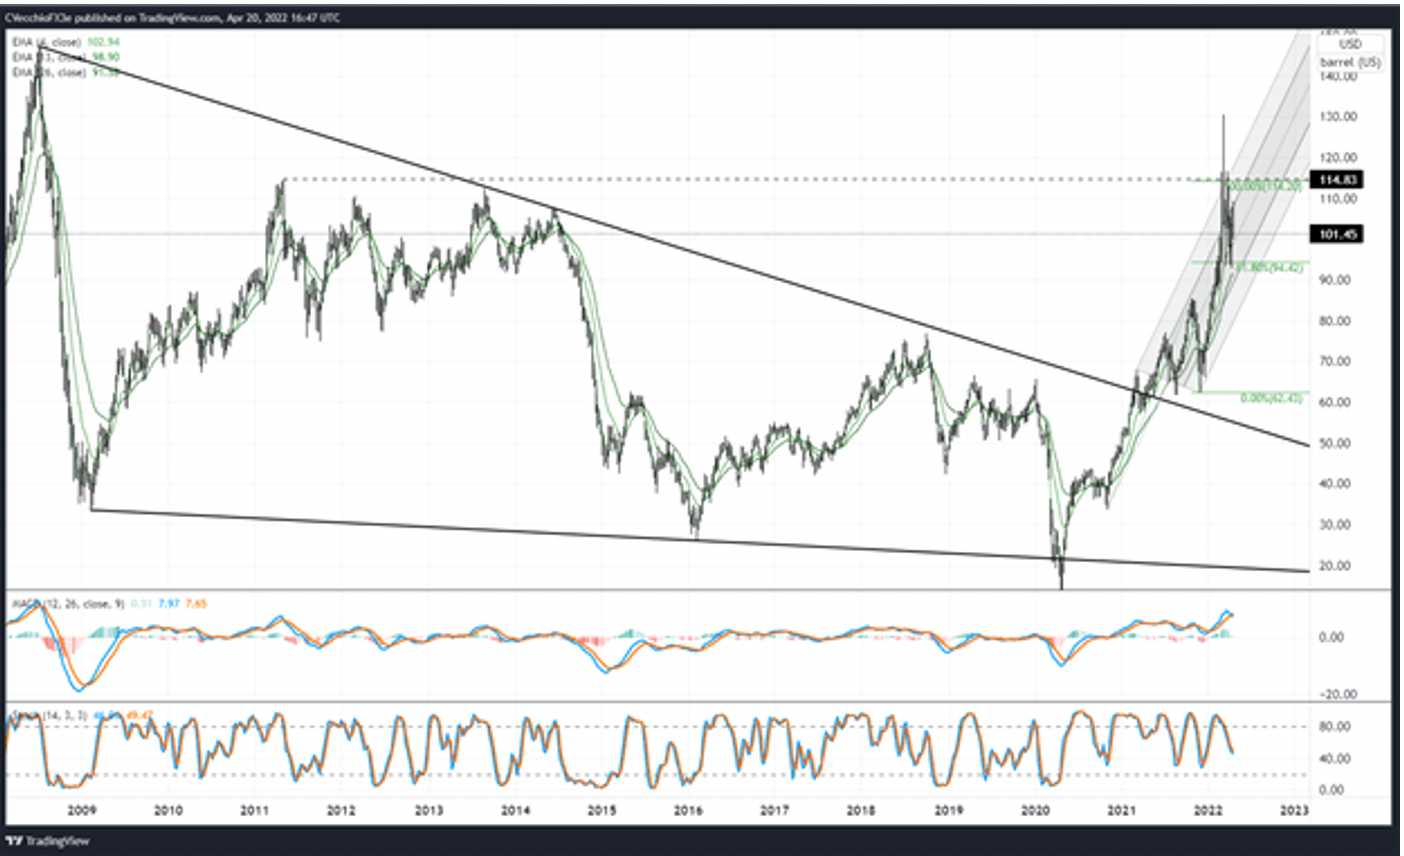
On the weekly timeframe, it remains clear that that bullish momentum has stalled. While crude oil prices are back above their weekly 4-, 8-, and 13-EMAs, weekly MACD is on the cusp of issuing a sell signal (albeit above its signal line) and weekly Slow Stochastics are continuing to trend lower towards their median line. It still remains preferred to “focus on lower-term timeframes (4-hour, daily)…for the foreseeable future.”
IG CLIENT SENTIMENT INDEX: CRUDE OIL PRICE FORECAST (APRIL 20, 2022) (CHART 4)
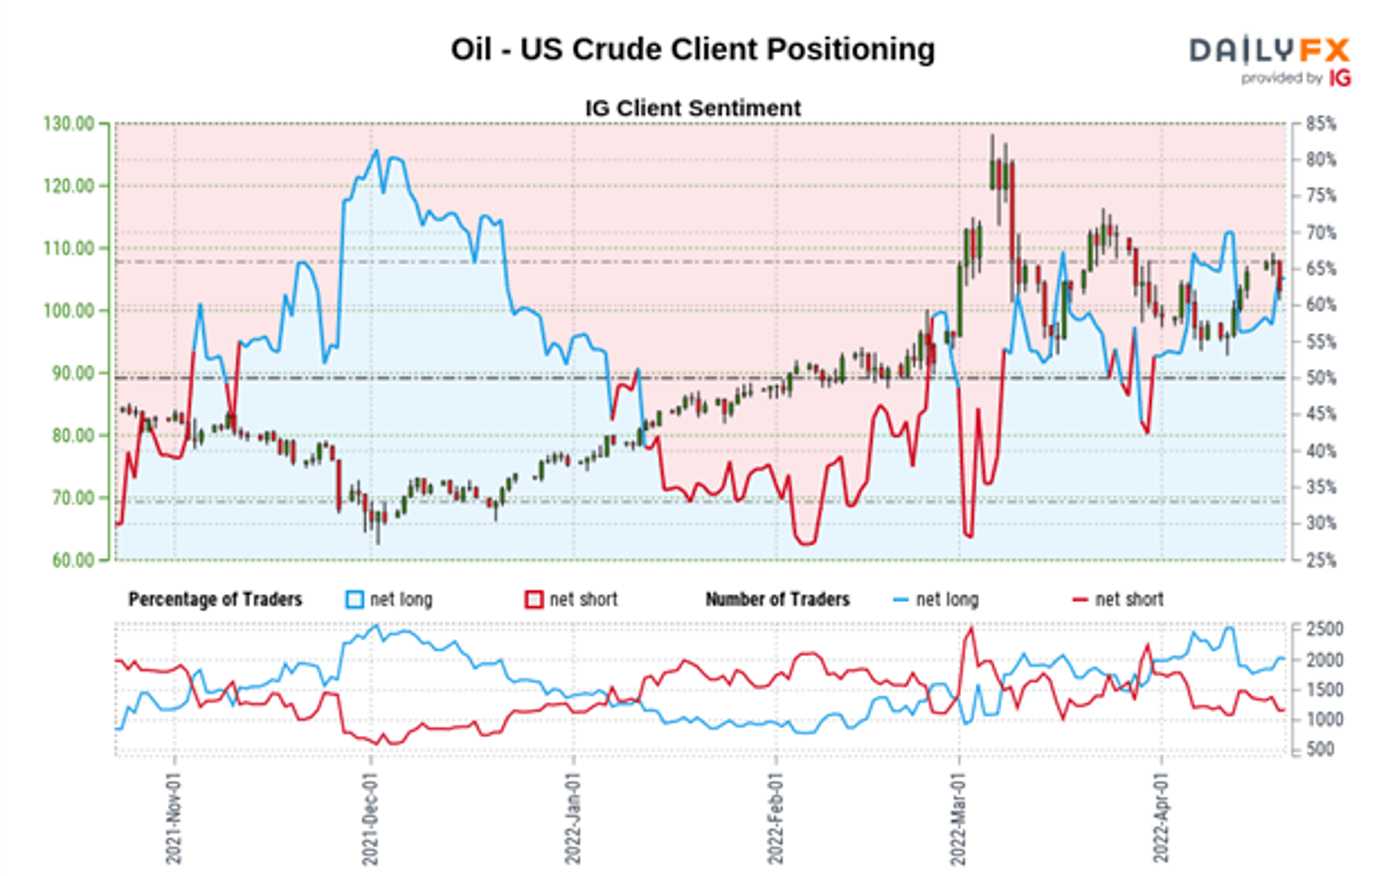
Oil - US Crude: Retail trader data shows 60.73% of traders are net-long with the ratio of traders long to short at 1.55 to 1. The number of traders net-long is 13.42% higher than yesterday and 7.95% lower from last week, while the number of traders net-short is 7.83% lower than yesterday and 2.41% lower from last week.
We typically take a contrarian view to crowd sentiment, and the fact traders are net-long suggests Oil - US Crude prices may continue to fall.
Positioning is more net-long than yesterday but less net-long from last week. The combination of current sentiment and recent changes gives us a further mixed Oil - US Crude trading bias.
--- Written by Christopher Vecchio, CFA, Senior Strategist
Options involve risk and are not suitable for all investors. Please read Characteristics and Risks of Standardized Options before deciding to invest in options.
tastylive content is created, produced, and provided solely by tastylive, Inc. (“tastylive”) and is for informational and educational purposes only. It is not, nor is it intended to be, trading or investment advice or a recommendation that any security, futures contract, digital asset, other product, transaction, or investment strategy is suitable for any person. Trading securities, futures products, and digital assets involve risk and may result in a loss greater than the original amount invested. tastylive, through its content, financial programming or otherwise, does not provide investment or financial advice or make investment recommendations. Investment information provided may not be appropriate for all investors and is provided without respect to individual investor financial sophistication, financial situation, investing time horizon or risk tolerance. tastylive is not in the business of transacting securities trades, nor does it direct client commodity accounts or give commodity trading advice tailored to any particular client’s situation or investment objectives. Supporting documentation for any claims (including claims made on behalf of options programs), comparisons, statistics, or other technical data, if applicable, will be supplied upon request. tastylive is not a licensed financial adviser, registered investment adviser, or a registered broker-dealer. Options, futures, and futures options are not suitable for all investors. Prior to trading securities, options, futures, or futures options, please read the applicable risk disclosures, including, but not limited to, the Characteristics and Risks of Standardized Options Disclosure and the Futures and Exchange-Traded Options Risk Disclosure found on tastytrade.com/disclosures.
tastytrade, Inc. ("tastytrade”) is a registered broker-dealer and member of FINRA, NFA, and SIPC. tastytrade was previously known as tastyworks, Inc. (“tastyworks”). tastytrade offers self-directed brokerage accounts to its customers. tastytrade does not give financial or trading advice, nor does it make investment recommendations. You alone are responsible for making your investment and trading decisions and for evaluating the merits and risks associated with the use of tastytrade’s systems, services or products. tastytrade is a wholly-owned subsidiary of tastylive, Inc.
tastytrade has entered into a Marketing Agreement with tastylive (“Marketing Agent”) whereby tastytrade pays compensation to Marketing Agent to recommend tastytrade’s brokerage services. The existence of this Marketing Agreement should not be deemed as an endorsement or recommendation of Marketing Agent by tastytrade. tastytrade and Marketing Agent are separate entities with their own products and services. tastylive is the parent company of tastytrade.
tastyfx, LLC (“tastyfx”) is a Commodity Futures Trading Commission (“CFTC”) registered Retail Foreign Exchange Dealer (RFED) and Introducing Broker (IB) and Forex Dealer Member (FDM) of the National Futures Association (“NFA”) (NFA ID 0509630). Leveraged trading in foreign currency or off-exchange products on margin carries significant risk and may not be suitable for all investors. We advise you to carefully consider whether trading is appropriate for you based on your personal circumstances as you may lose more than you invest.
tastycrypto is provided solely by tasty Software Solutions, LLC. tasty Software Solutions, LLC is a separate but affiliate company of tastylive, Inc. Neither tastylive nor any of its affiliates are responsible for the products or services provided by tasty Software Solutions, LLC. Cryptocurrency trading is not suitable for all investors due to the number of risks involved. The value of any cryptocurrency, including digital assets pegged to fiat currency, commodities, or any other asset, may go to zero.
© copyright 2013 - 2026 tastylive, Inc. All Rights Reserved. Applicable portions of the Terms of Use on tastylive.com apply. Reproduction, adaptation, distribution, public display, exhibition for profit, or storage in any electronic storage media in whole or in part is prohibited under penalty of law, provided that you may download tastylive’s podcasts as necessary to view for personal use. tastylive was previously known as tastytrade, Inc. tastylive is a trademark/servicemark owned by tastylive, Inc.
Your privacy choices