The Relationship Between Crude Oil Volatility and Hurricane Season

The Relationship Between Crude Oil Volatility and Hurricane Season
Gulf Coast rigs account for 15% of U.S. crude production and 50% of U.S. petroleum refining
Crude oil prices and volatility, as measured by the OVX, are negatively correlated.
Hurricanes pose a threat to the U.S. crude oil complex on the Gulf Coast.
Does hurricane season create favorable conditions for crude oil volatility?
Crude oil volatility: an analysis of volatility during hurricane season
Many active investors believe hurricane season creates favorable volatility in crude oil prices. It is predicated on the fact that onshore and offshore rigs in the Gulf of Mexico (GOM) account for about 15% of total U.S. crude production and nearly 50% of U.S. petroleum refining capacity, specifically refiners along the Louisiana and Texas Gulf Coast.
Crude oil volatility: Using the OVX to measure volatility
We’ll examine how crude oil prices and volatility interact with each other and analyze that relationship during and outside of the official U.S. hurricane season.
To measure volatility in crude oil prices, we’ll use the Chicago Board Options Exchange’s (CBOE) crude oil volatility index, or OVX. According to the CBOE, the OVX is “an estimate of the expected 30-day volatility of crude oil as priced by the United States Oil Fund (USO).” It is essentially the VIX Index, but for crude oil prices.
Traders use the United States Oil Fund to speculate on the price of oil. When uncertainty rises, it can increase volatility. If a hurricane is forecasted to hit the GOM (Gulf of Mexico, traders may seek protection because it’s hard to predict the precise affects a storm would have on oil production, refinery operations and power demand.
Crude oil prices and OVX: how the two interact
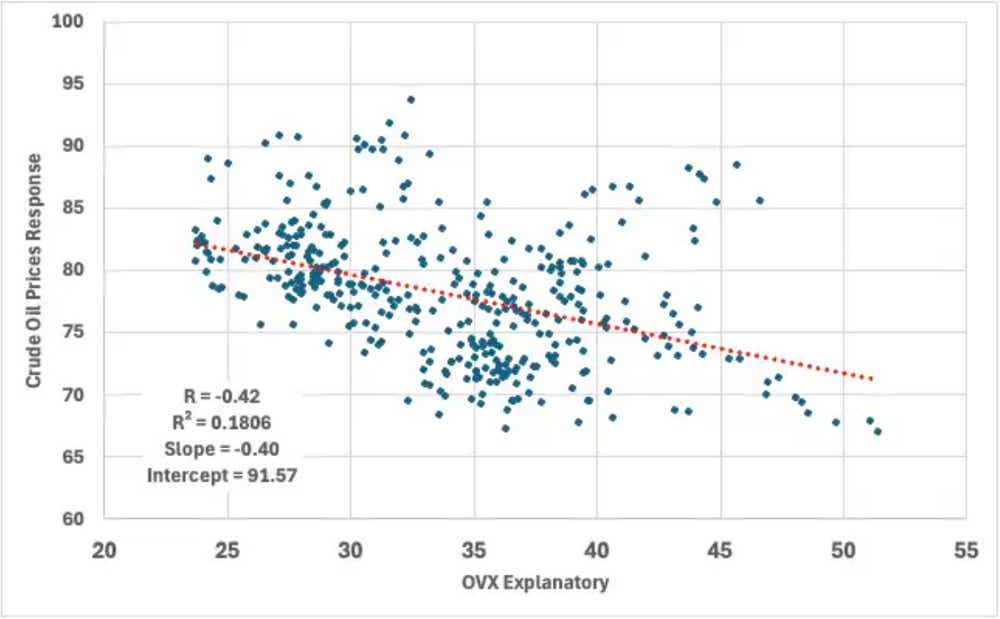
The correlation between the OVX and crude oil prices isn’t perfect. Before we dive into examining how hurricanes affect crude oil volatility, let’s look at how crude oil prices react to changes in the OVX.
A regression analysis models the statistical relationship between the two. The correlation coefficient, or R value, shows a value of -0.42, meaning there is a moderate negative linear relationship, i.e., as volatility increases, crude oil prices fall.
The R value aligns with the -0.4 slope value, or regression coefficient. That is, for every one point increase in the OVX, there is a 0.4 decline in crude oil prices.
The R-squared value, or coefficient of determination, is 0.1806. So, about 18% of the change in crude oil prices is attributable to changes in the OVX.
Does crude oil volatility rise during hurricane season?
The official U.S. hurricane season runs from June 1 to Nov. 30, according to the National Hurricane Center (NHC).
When a hurricane threatens the safety of workers or operations, rig operators and refiners take steps to protect those personnel and equipment. These shutdowns temporarily reduce, but often don’t eliminate, the amount of oil being pumped or refined in the Gulf.
We’ll analyze crude oil volatility by averaging the monthly closing price of the OVX during and outside of the hurricane season.
The OVX was launched in 2008, so we’ll start there.
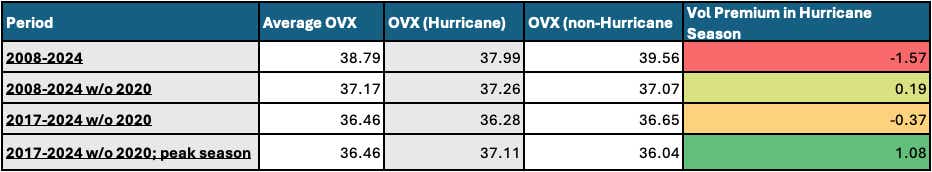
The average OVX value for 2008 to 2024 is 38.79. The average OVX from June 1 to Nov. 30 during that time is 37.99. We can already see volatility must be higher outside the hurricane season—and indeed it is. The OVX outside of hurricane season is 39.56 for the same period.
Obviously, this is surprising at face value. However, when we look at the chart below, we can see the OVX has a massive spike during 2020. This was caused by the emergence of COVID-19, which caused demand to fall much faster than suppliers could cut production. There was so much oil that producers were paying anyone with storage capacity to get rid of it.
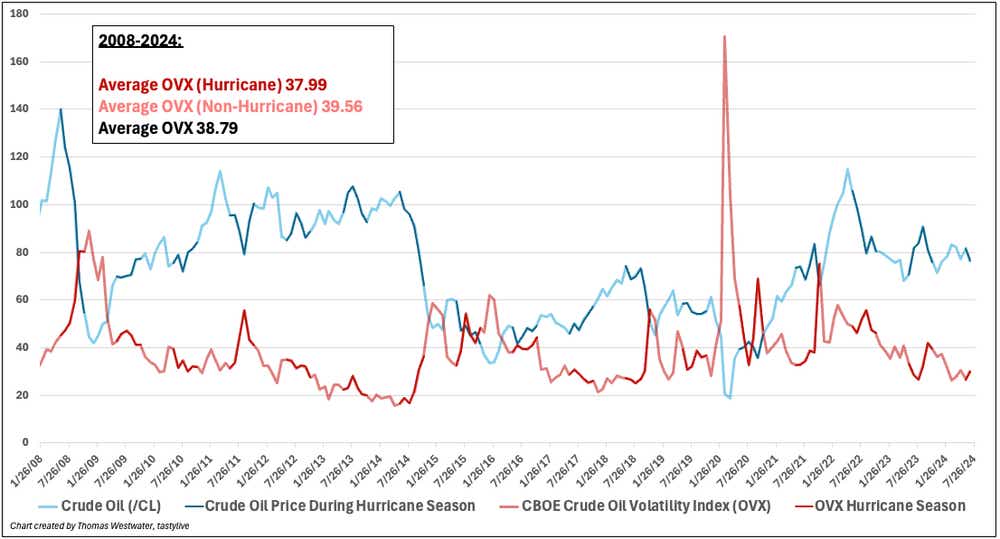
Because we can write off the Covid pandemic as an extortionary event, and also because it’s also messing up our data, let’s remove it as an outlier.
Excluding 2020, the average OVX is lower at 37.17, which is not surprising, given that the OVX spiked to a record high of 170 in 2020. Outside of hurricane season, the OVX registered a 37.07 average. During hurricane season, it averaged 37.26, confirming oil volatility is on average higher during hurricane season.
Crude oil volatility in the modern era of U.S. oil
The U.S. crude oil market of 2008 was much different than today’s.
In 2008, the U.S. produced around 5 million barrels per day (mbpd). Today it produces over 13 mbpd—the world leader in crude production.
The U.S. was also an oil and fuels importer in 2008, with net imports of about 11 mbpd. In 2023, the U.S. was a net petroleum exporter of about 1.6 mbpd, according to the Energy Information Administration (EIA).
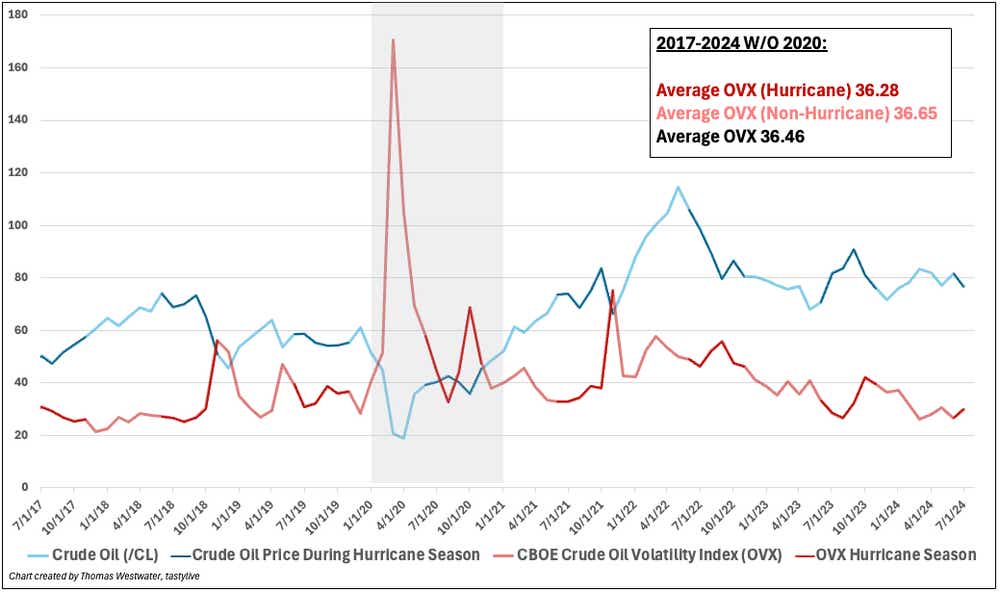
To capture how volatility reacts to hurricane season during what we’ll call the modern age of U.S. oil, let’s run the numbers again. This time we’ll look back to July 2017, while excluding 2020, capturing about six years’ worth of data.
The average OVX during that time was 36.46. The average OVX outside of hurricane season was 36.65, and the average OVX during hurricane season was 36.28.
This result shows no volatility premium during the hurricane season since 2017.
This could potentially be explained by the fact that weather forecasting has improved dramatically in recent years. That, along with other factors, allows rig operators and refiners to better plan and manage potential risks from storms.
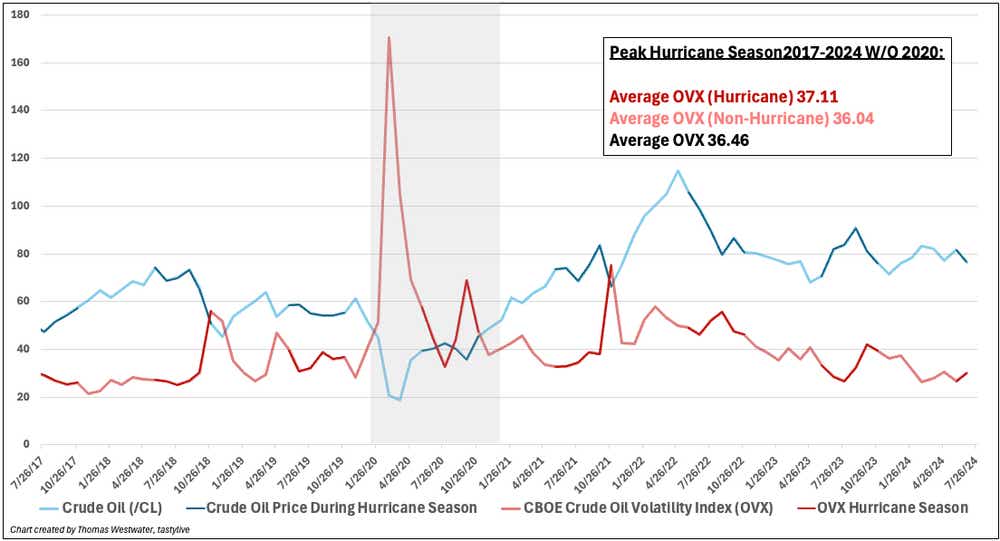
Peak hurricane season: Does it make a difference?
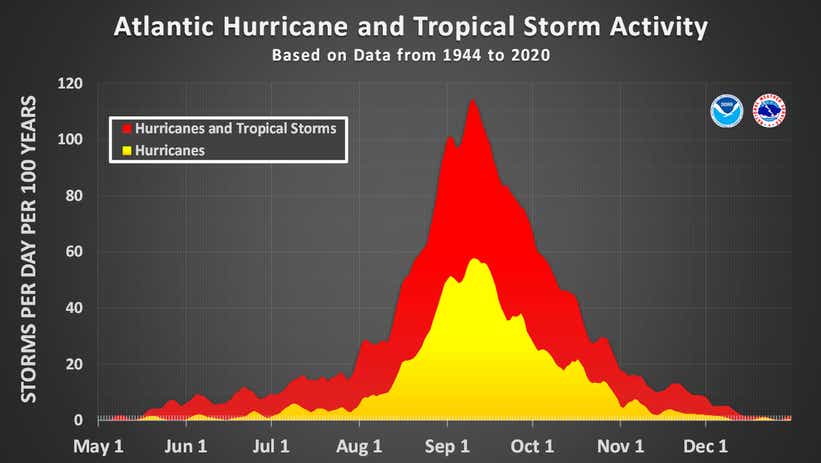
The National Hurricane Center (NHC) found peak hurricane season occurs between mid-August and mid-October, which is when the bulk of storm activity occurs, with Sept. 10 marking the peak of activity, based on an analysis of data from 1944 to 2020.
We’ll use this period to analyze the data because the GOM crude complex would be most affected by peak hurricane season, given the intensity and volume of storms.
To recalibrate the data, we’ll look back to July 2017 and exclude 2020 in this iteration, measuring the averages for the OVX during peak hurricane season and outside of it.
The new data shows an average OVX of 37.11 during peak hurricane season and an average of 36.04 outside of peak hurricane season.
That gives us the largest volatility premium from our datasets. It makes sense that volatility would increase during this time because of the impact of stronger and more numerous storms.
Takeaways from the analysis
Based on the data, we can expect an average increase of 1.08 in the OVX during peak hurricane season, which would cause a $0.43 drop in the price of crude oil, based on the regression analysis.
However, we must remember that the OVX is responsible for only about 18% of the change in crude oil prices. It’s also important to realize that crude oil prices may rise or fall when a hurricane approaches the GOM based on factors outside of volatility.
Altogether, this tells us that we should be aware of, but not dependent on, the impact that hurricane season can have on crude oil prices through volatility.
We can apply a bit of caution during the peak hurricane season, given the volatility premium during that period from mid-August to mid-October. An increase in the OVX can make crude oil futures options more expensive because of an increased risk premium.
As with most commodities, prices are dictated first and foremost by supply and demand factors, along with geopolitical and economic forces.
Thomas Westwater, a tastylive financial writer and analyst, has eight years of markets and trading experience. @fxwestwater
For live daily programming, market news and commentary, visit tastylive or the YouTube channels tastylive (for options traders), and tastyliveTrending for stocks, futures, forex & macro.
Trade with a better broker, open a tastytrade account today. tastylive, Inc. and tastytrade, Inc. are separate but affiliated companies.
Options involve risk and are not suitable for all investors. Please read Characteristics and Risks of Standardized Options before deciding to invest in options.
tastylive content is created, produced, and provided solely by tastylive, Inc. (“tastylive”) and is for informational and educational purposes only. It is not, nor is it intended to be, trading or investment advice or a recommendation that any security, futures contract, digital asset, other product, transaction, or investment strategy is suitable for any person. Trading securities, futures products, and digital assets involve risk and may result in a loss greater than the original amount invested. tastylive, through its content, financial programming or otherwise, does not provide investment or financial advice or make investment recommendations. Investment information provided may not be appropriate for all investors and is provided without respect to individual investor financial sophistication, financial situation, investing time horizon or risk tolerance. tastylive is not in the business of transacting securities trades, nor does it direct client commodity accounts or give commodity trading advice tailored to any particular client’s situation or investment objectives. Supporting documentation for any claims (including claims made on behalf of options programs), comparisons, statistics, or other technical data, if applicable, will be supplied upon request. tastylive is not a licensed financial adviser, registered investment adviser, or a registered broker-dealer. Options, futures, and futures options are not suitable for all investors. Prior to trading securities, options, futures, or futures options, please read the applicable risk disclosures, including, but not limited to, the Characteristics and Risks of Standardized Options Disclosure and the Futures and Exchange-Traded Options Risk Disclosure found on tastytrade.com/disclosures.
tastytrade, Inc. ("tastytrade”) is a registered broker-dealer and member of FINRA, NFA, and SIPC. tastytrade was previously known as tastyworks, Inc. (“tastyworks”). tastytrade offers self-directed brokerage accounts to its customers. tastytrade does not give financial or trading advice, nor does it make investment recommendations. You alone are responsible for making your investment and trading decisions and for evaluating the merits and risks associated with the use of tastytrade’s systems, services or products. tastytrade is a wholly-owned subsidiary of tastylive, Inc.
tastytrade has entered into a Marketing Agreement with tastylive (“Marketing Agent”) whereby tastytrade pays compensation to Marketing Agent to recommend tastytrade’s brokerage services. The existence of this Marketing Agreement should not be deemed as an endorsement or recommendation of Marketing Agent by tastytrade. tastytrade and Marketing Agent are separate entities with their own products and services. tastylive is the parent company of tastytrade.
tastyfx, LLC (“tastyfx”) is a Commodity Futures Trading Commission (“CFTC”) registered Retail Foreign Exchange Dealer (RFED) and Introducing Broker (IB) and Forex Dealer Member (FDM) of the National Futures Association (“NFA”) (NFA ID 0509630). Leveraged trading in foreign currency or off-exchange products on margin carries significant risk and may not be suitable for all investors. We advise you to carefully consider whether trading is appropriate for you based on your personal circumstances as you may lose more than you invest.
tastycrypto is provided solely by tasty Software Solutions, LLC. tasty Software Solutions, LLC is a separate but affiliate company of tastylive, Inc. Neither tastylive nor any of its affiliates are responsible for the products or services provided by tasty Software Solutions, LLC. Cryptocurrency trading is not suitable for all investors due to the number of risks involved. The value of any cryptocurrency, including digital assets pegged to fiat currency, commodities, or any other asset, may go to zero.
© copyright 2013 - 2026 tastylive, Inc. All Rights Reserved. Applicable portions of the Terms of Use on tastylive.com apply. Reproduction, adaptation, distribution, public display, exhibition for profit, or storage in any electronic storage media in whole or in part is prohibited under penalty of law, provided that you may download tastylive’s podcasts as necessary to view for personal use. tastylive was previously known as tastytrade, Inc. tastylive is a trademark/servicemark owned by tastylive, Inc.
Your privacy choices