Energy Stocks Are Defining a Base. Here are Three Tickers for Traders

Energy Stocks Are Defining a Base. Here are Three Tickers for Traders
Fundamental and technical indicators imply an imminent uptrend in two energy ETFs and one well-positioned oil refining stock
- Both /CL and /NG have been exhibiting atypical price action relative to the past few months of range-bound trading.
- Stability and strength in energy commodities should translate into a favorable environment for related equities.
- CRAK, XLE and XOP are all showing signs of basing, potentially signaling the start of an uptrend through the remainder of 2023.
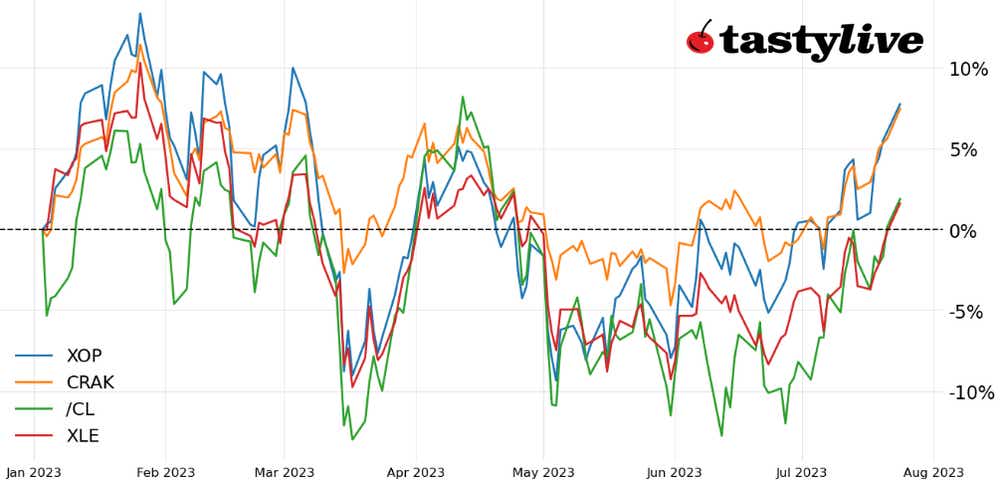
Market Update: XLE down 3.85% year-to-date
Conditions in energy markets are changing. Price ranges that have been reliable for large portions of 2023 appear to be breaking. This may be due, in part, to shifting fundamentals of the supply/demand dynamic underlying oil prices: The crude oil prompt spread has reached its highest level since November 2022. And with the fewest net-longs held by speculators in the futures market since 2001, there is ample room for traders to pile into positions to push prices higher.
Yet, if crude oil prices are getting ready to move higher, /CL may not be the best way to express this view. Instead, turning to the equities market may be more appropriate. After all, as crude oil prices rallied over +70% to their 2022 highs last year, they finished up by only 6.71%. But XLE, the Energy Select Sector exchange-traded fund (ETF), closed out last year with a 57.6% gain.
Energy bulls vs. bears
If you’re an energy bull, the individual stocks and ETFs have been more reliable to the upside, whereas if you’re an energy bear, the commodity itself has been a better vehicle over the past year. And now that crude oil prices are exhibiting signs of breaking out higher, it may be time to turn our attention back to XLE, XOP and CRAK. In other words, it may be time to be an "oil man” again.
XLE Price Technical Analysis: Daily Chart (July 2022 to July 2023)
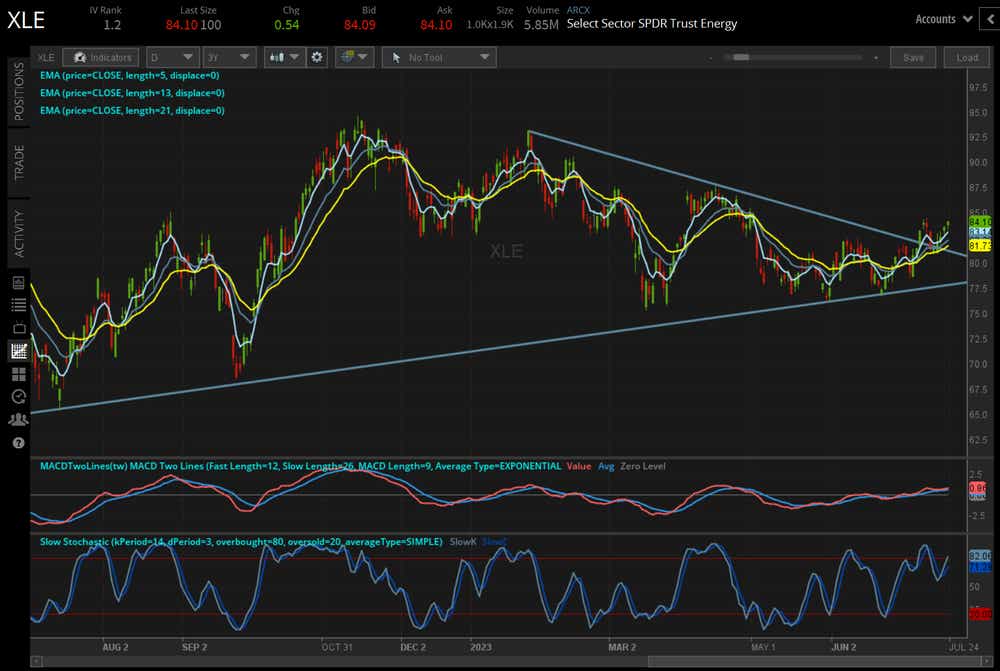
XLE has been consolidating into a symmetrical triangle for the past 12 months. The start of July produced a breakout from the downtrend off of the January and April swing highs, and the subsequent pullback saw the former trendline resistance hold up as support. The momentum profile has improved, with moving average convergence/divergence (MACD) trending higher above its signal line while slow stochastics have moved back into overbought territory. A return to the April high at 87.74 is the next hurdle to clear.
XOP Price Technical Analysis: Daily Chart (July 2022 to July 2023)
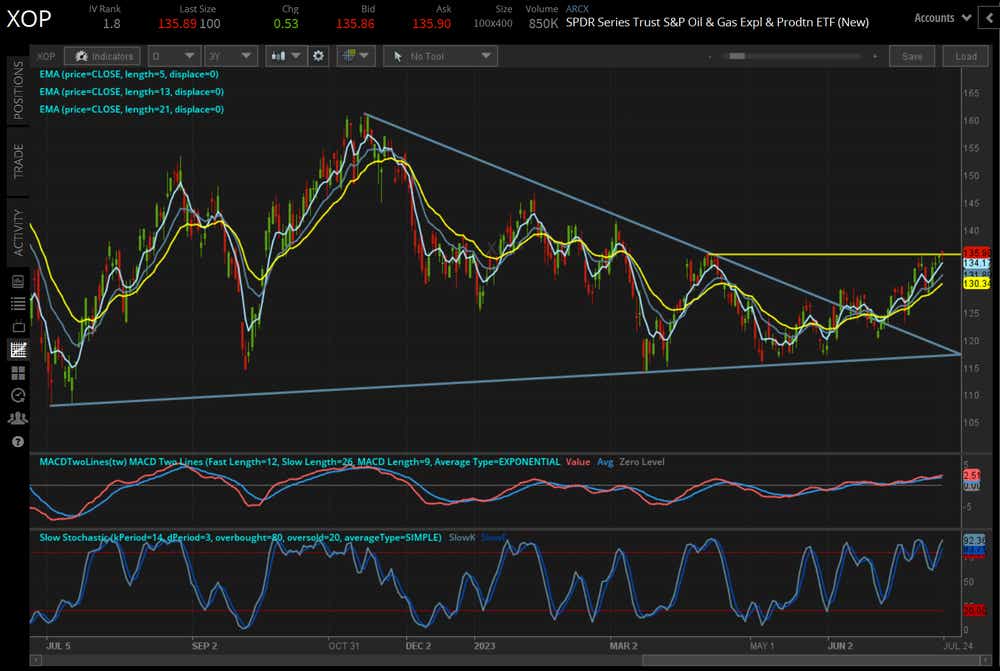
XOP has a similar technical structure to XLE, but due to weighting differences between the two exchange-traded funds (ETFs), similar does not mean the same: XOP has already achieved its April high at 135.90, following its symmetrical triangle breakout. If anything, this serves as contemporaneous evidence that energy sector ETFs are well positioned in the near-term. The momentum structure is a bullish flush (MACD, slow stochastics and moving averages all in bullish order); clearing 135.90 opens the door for a move above 140 in the near-term.
CRAK Price Technical Analysis: Daily Chart (April 2022 to July 2023)
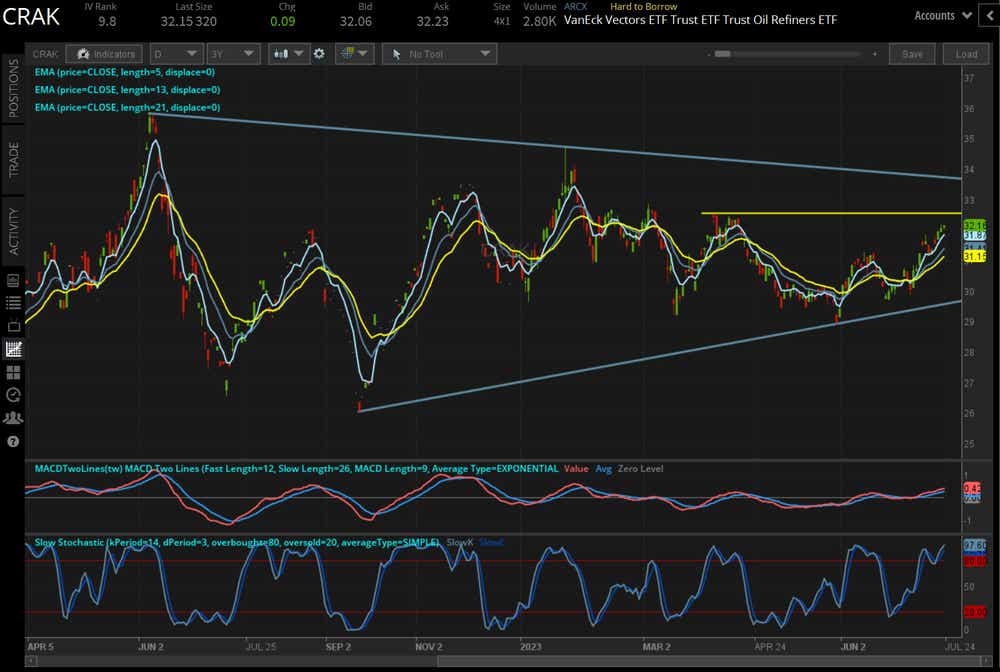
A symmetrical triangle
CRAK tracks refiners, not producers, like XLE and XOP. Nevertheless, as with its two energy sector ETF brethren, the technical signposts are suggesting the path of least resistance is to the upside. CRAK is racing toward its April high at 32.55, beyond which the March high at 32.66 comes into focus. Big picture: CRAK remains in a symmetrical triangle that began in June 2022, and triangle resistance comes in closer to 33.75-34 over the coming weeks. Should CRAK overtake this zone before the end of August, a return to the all-time highs near 36 would become the key focal point through the remainder of 2023.
Christopher Vecchio, CFA, tastylive’s head of futures and forex, has been trading for nearly 20 years. He has consulted with multi-national firms on FX hedging and lectured at Duke Law School on FX derivatives. Vecchio searches for high-convexity opportunities at the crossroads of macroeconomics and global politics. He hosts Futures Power Hour Monday-Friday and Let Me Explain on Tuesdays, and co-hosts Overtime, Monday-Thursday. @cvecchiofx
For live daily programming, market news and commentary, visit tastylive or the YouTube channels tastylive (for options traders), and tastyliveTrending for stocks, futures, forex & macro.
Trade with a better broker, open a tastytrade account today. tastylive, Inc. and tastytrade, Inc. are separate but affiliated companies.
Options involve risk and are not suitable for all investors. Please read Characteristics and Risks of Standardized Options before deciding to invest in options.
tastylive content is created, produced, and provided solely by tastylive, Inc. (“tastylive”) and is for informational and educational purposes only. It is not, nor is it intended to be, trading or investment advice or a recommendation that any security, futures contract, digital asset, other product, transaction, or investment strategy is suitable for any person. Trading securities, futures products, and digital assets involve risk and may result in a loss greater than the original amount invested. tastylive, through its content, financial programming or otherwise, does not provide investment or financial advice or make investment recommendations. Investment information provided may not be appropriate for all investors and is provided without respect to individual investor financial sophistication, financial situation, investing time horizon or risk tolerance. tastylive is not in the business of transacting securities trades, nor does it direct client commodity accounts or give commodity trading advice tailored to any particular client’s situation or investment objectives. Supporting documentation for any claims (including claims made on behalf of options programs), comparisons, statistics, or other technical data, if applicable, will be supplied upon request. tastylive is not a licensed financial adviser, registered investment adviser, or a registered broker-dealer. Options, futures, and futures options are not suitable for all investors. Prior to trading securities, options, futures, or futures options, please read the applicable risk disclosures, including, but not limited to, the Characteristics and Risks of Standardized Options Disclosure and the Futures and Exchange-Traded Options Risk Disclosure found on tastytrade.com/disclosures.
tastytrade, Inc. ("tastytrade”) is a registered broker-dealer and member of FINRA, NFA, and SIPC. tastytrade was previously known as tastyworks, Inc. (“tastyworks”). tastytrade offers self-directed brokerage accounts to its customers. tastytrade does not give financial or trading advice, nor does it make investment recommendations. You alone are responsible for making your investment and trading decisions and for evaluating the merits and risks associated with the use of tastytrade’s systems, services or products. tastytrade is a wholly-owned subsidiary of tastylive, Inc.
tastytrade has entered into a Marketing Agreement with tastylive (“Marketing Agent”) whereby tastytrade pays compensation to Marketing Agent to recommend tastytrade’s brokerage services. The existence of this Marketing Agreement should not be deemed as an endorsement or recommendation of Marketing Agent by tastytrade. tastytrade and Marketing Agent are separate entities with their own products and services. tastylive is the parent company of tastytrade.
tastyfx, LLC (“tastyfx”) is a Commodity Futures Trading Commission (“CFTC”) registered Retail Foreign Exchange Dealer (RFED) and Introducing Broker (IB) and Forex Dealer Member (FDM) of the National Futures Association (“NFA”) (NFA ID 0509630). Leveraged trading in foreign currency or off-exchange products on margin carries significant risk and may not be suitable for all investors. We advise you to carefully consider whether trading is appropriate for you based on your personal circumstances as you may lose more than you invest.
tastycrypto is provided solely by tasty Software Solutions, LLC. tasty Software Solutions, LLC is a separate but affiliate company of tastylive, Inc. Neither tastylive nor any of its affiliates are responsible for the products or services provided by tasty Software Solutions, LLC. Cryptocurrency trading is not suitable for all investors due to the number of risks involved. The value of any cryptocurrency, including digital assets pegged to fiat currency, commodities, or any other asset, may go to zero.
© copyright 2013 - 2026 tastylive, Inc. All Rights Reserved. Applicable portions of the Terms of Use on tastylive.com apply. Reproduction, adaptation, distribution, public display, exhibition for profit, or storage in any electronic storage media in whole or in part is prohibited under penalty of law, provided that you may download tastylive’s podcasts as necessary to view for personal use. tastylive was previously known as tastytrade, Inc. tastylive is a trademark/servicemark owned by tastylive, Inc.
Your privacy choices