A Pair of Powerful Fibonaccis

A Pair of Powerful Fibonaccis
By:Tim Knight
Our resident technician looks at seven ETFs for new trade ideas
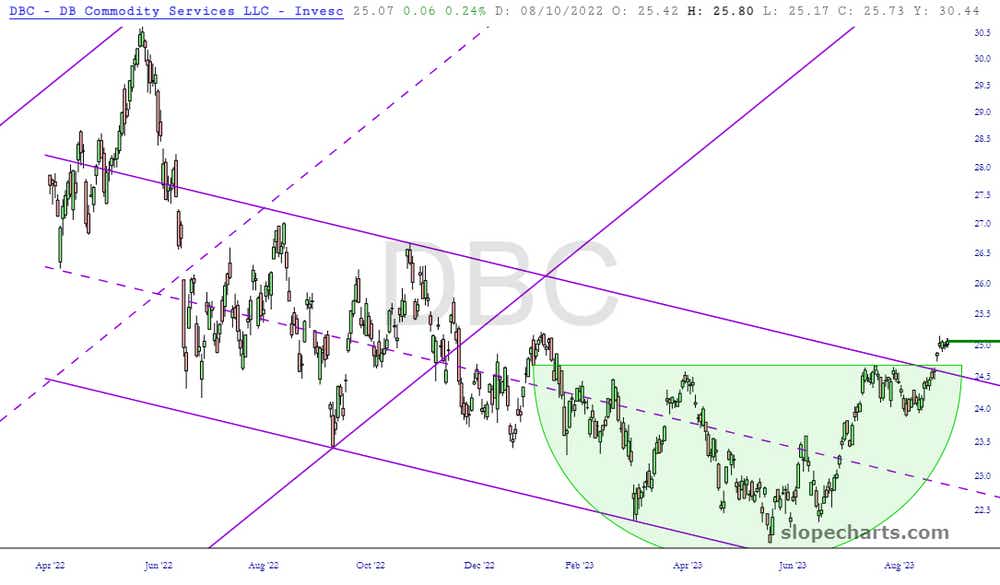
- DBC is looking bullish.
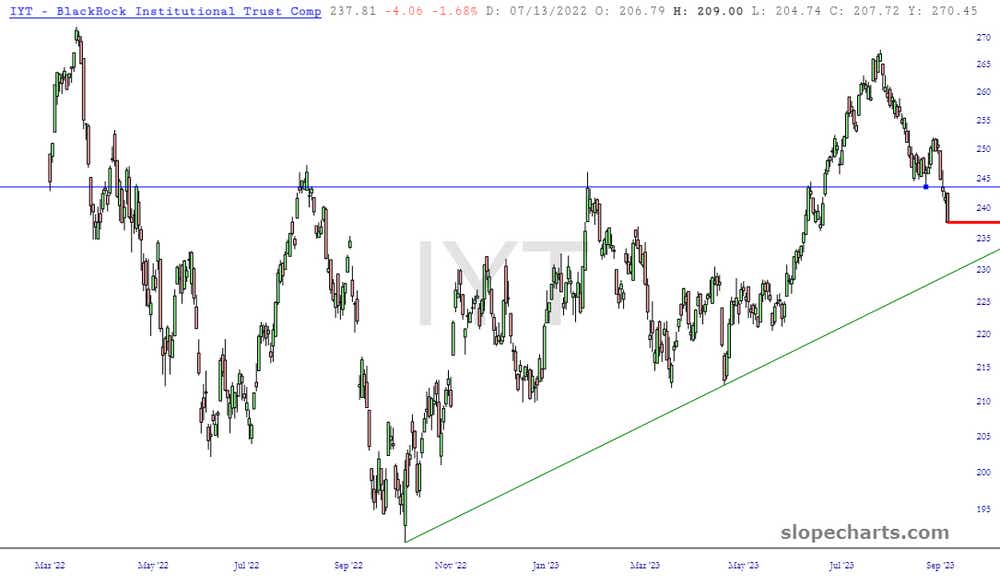
- Dow Transports fracture and splinter.
- The semiconductor index looks bearish.
We begin with Invesco DB Commodity Index Tracking Fund (DBC), the commodity fund, which is looking fairly bullish. Not only have prices busted above the descending channel, but there’s a well-formed base I’ve tinted in green which suggests higher prices again. Thus, more inflation, which might put the Federal Open Market Committee in a tight spot in 2024.
Dow Transports fracture
The Dow Transports are starting to fracture and splinter. As of the end of July, it looked like the bulls were going to completely dominate any surviving bears. As of now, it’s just one failed bullish breakout after another, with this one being a higher interest rate.
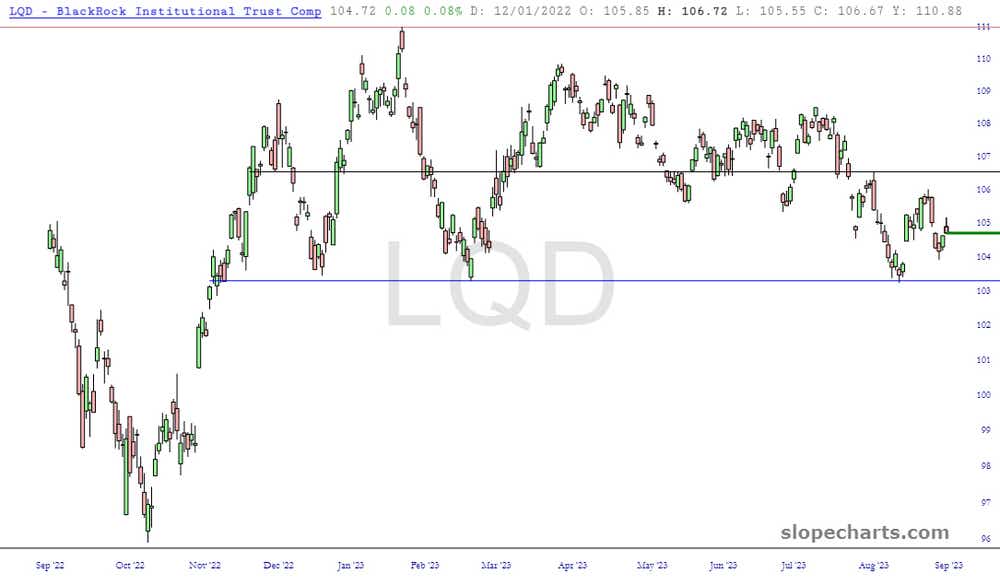
The corporate bond fund has been range-bound for eons. If we can take out that lower supporting horizontal line, higher interest rates (and higher corporate expense to support them) are at hand.
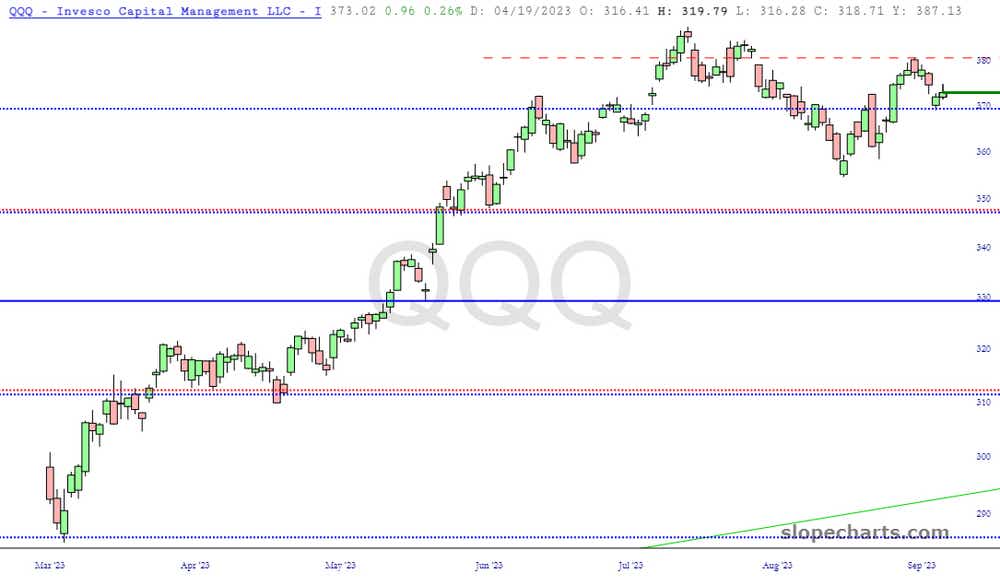
The tech stocks are interesting right now. On the upside, we have that dashed line representing the price gap hemming in prices, and to the downside, we’ve got a Fibonacci sequence, which provided strong support on Thursday. Break it, and the market has an opportunity to work toward that lower level, shown with the magenta line, which is two Fibonaccis that converge at almost the same spot.
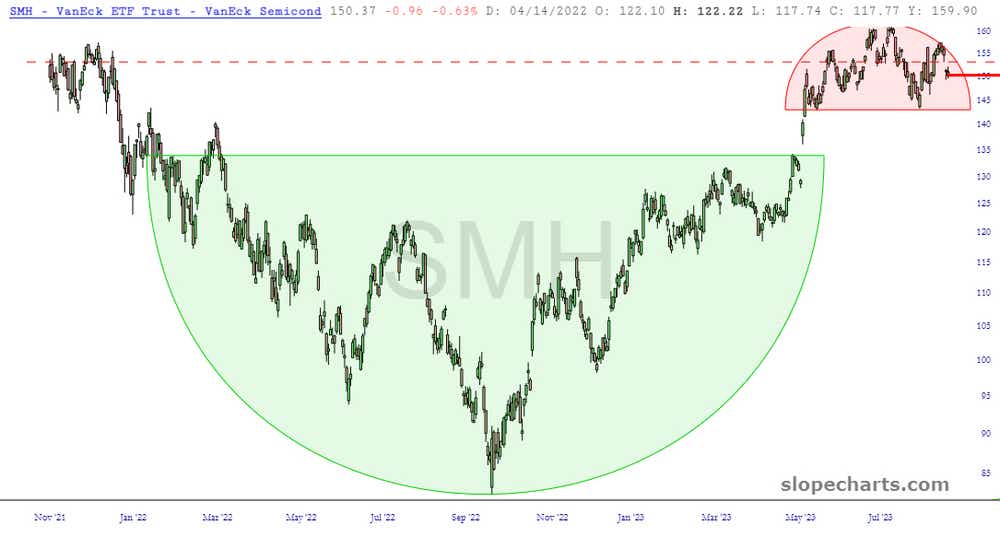
Semiconductor index looks bearish
The semiconductor index is looking potentially like a great bearish trade. So far, so good. I think this is one of the best set-ups going as I contemplate the week in front of us.
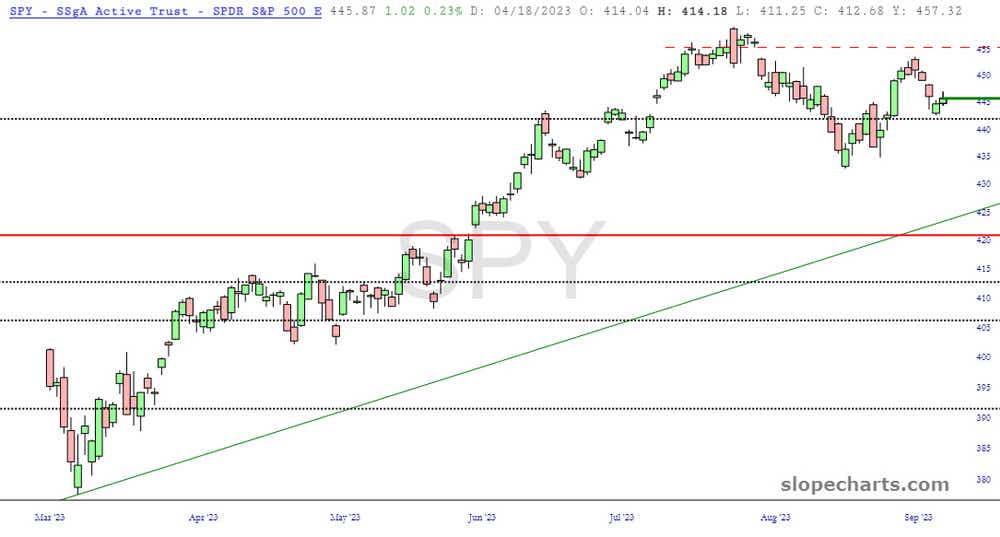
The S&P 500 ETF has an identical setup to that of the QQQ. We’ve got a dashed line acting as resistance, based on that price gap, but we need to pierce the horizontal Fibonacci to give us the opportunity to hammer down to that supporting, ascending trendline, shown in green below.
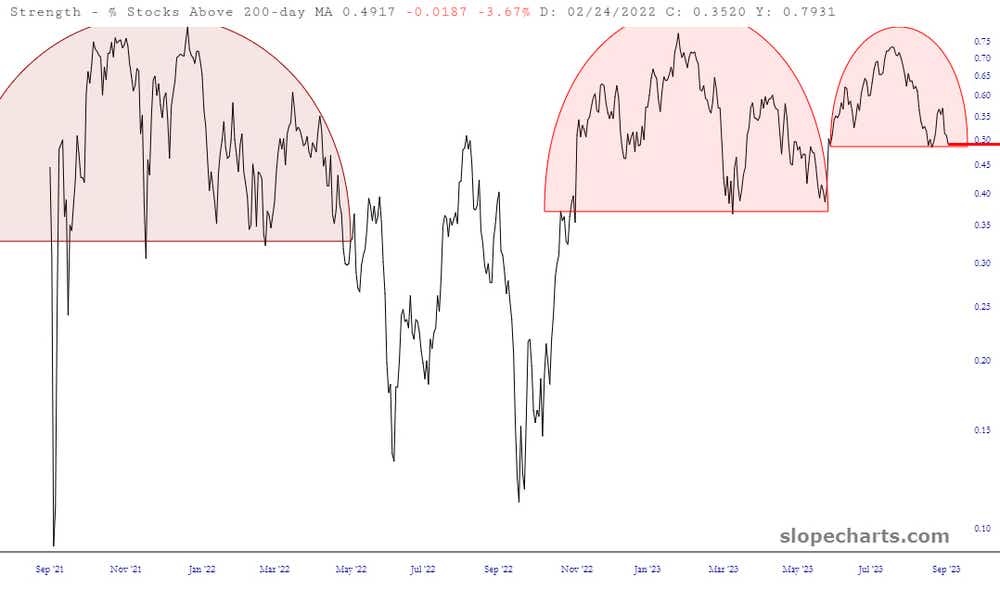
Lastly, here is an updated chart of the percentage of stocks above their respective 200-day moving averages. Pretty compelling how clean the topping pattern is, isn’t it? I find it fascinating that even a derived indicator such as this has the courtesy to form a shape. This time, we could break below the pattern. We were JUST about to do so gloriously last March, but of course the BTFP program launched by the Treasury department delayed that, at least until now.
Tim Knight, a charting analyst with 35 years of trading experience, hosts Trading Charts, a tastylive segment airing Monday-Friday. He founded slopeofhope.com in 2005 and uses it as the basis of his technical charting and analysis. Knight authors The Technician column for Luckbox magazine.
For live daily programming, market news and commentary, visit tastylive or the YouTube channels tastylive (for options traders), and tastyliveTrending for stocks, futures, forex & macro.
Trade with a better broker, open a tastytrade account today. tastylive, Inc. and tastytrade, Inc. are separate but affiliated companies.
Options involve risk and are not suitable for all investors. Please read Characteristics and Risks of Standardized Options before deciding to invest in options.
tastylive content is created, produced, and provided solely by tastylive, Inc. (“tastylive”) and is for informational and educational purposes only. It is not, nor is it intended to be, trading or investment advice or a recommendation that any security, futures contract, digital asset, other product, transaction, or investment strategy is suitable for any person. Trading securities, futures products, and digital assets involve risk and may result in a loss greater than the original amount invested. tastylive, through its content, financial programming or otherwise, does not provide investment or financial advice or make investment recommendations. Investment information provided may not be appropriate for all investors and is provided without respect to individual investor financial sophistication, financial situation, investing time horizon or risk tolerance. tastylive is not in the business of transacting securities trades, nor does it direct client commodity accounts or give commodity trading advice tailored to any particular client’s situation or investment objectives. Supporting documentation for any claims (including claims made on behalf of options programs), comparisons, statistics, or other technical data, if applicable, will be supplied upon request. tastylive is not a licensed financial adviser, registered investment adviser, or a registered broker-dealer. Options, futures, and futures options are not suitable for all investors. Prior to trading securities, options, futures, or futures options, please read the applicable risk disclosures, including, but not limited to, the Characteristics and Risks of Standardized Options Disclosure and the Futures and Exchange-Traded Options Risk Disclosure found on tastytrade.com/disclosures.
tastytrade, Inc. ("tastytrade”) is a registered broker-dealer and member of FINRA, NFA, and SIPC. tastytrade was previously known as tastyworks, Inc. (“tastyworks”). tastytrade offers self-directed brokerage accounts to its customers. tastytrade does not give financial or trading advice, nor does it make investment recommendations. You alone are responsible for making your investment and trading decisions and for evaluating the merits and risks associated with the use of tastytrade’s systems, services or products. tastytrade is a wholly-owned subsidiary of tastylive, Inc.
tastytrade has entered into a Marketing Agreement with tastylive (“Marketing Agent”) whereby tastytrade pays compensation to Marketing Agent to recommend tastytrade’s brokerage services. The existence of this Marketing Agreement should not be deemed as an endorsement or recommendation of Marketing Agent by tastytrade. tastytrade and Marketing Agent are separate entities with their own products and services. tastylive is the parent company of tastytrade.
tastyfx, LLC (“tastyfx”) is a Commodity Futures Trading Commission (“CFTC”) registered Retail Foreign Exchange Dealer (RFED) and Introducing Broker (IB) and Forex Dealer Member (FDM) of the National Futures Association (“NFA”) (NFA ID 0509630). Leveraged trading in foreign currency or off-exchange products on margin carries significant risk and may not be suitable for all investors. We advise you to carefully consider whether trading is appropriate for you based on your personal circumstances as you may lose more than you invest.
tastycrypto is provided solely by tasty Software Solutions, LLC. tasty Software Solutions, LLC is a separate but affiliate company of tastylive, Inc. Neither tastylive nor any of its affiliates are responsible for the products or services provided by tasty Software Solutions, LLC. Cryptocurrency trading is not suitable for all investors due to the number of risks involved. The value of any cryptocurrency, including digital assets pegged to fiat currency, commodities, or any other asset, may go to zero.
© copyright 2013 - 2025 tastylive, Inc. All Rights Reserved. Applicable portions of the Terms of Use on tastylive.com apply. Reproduction, adaptation, distribution, public display, exhibition for profit, or storage in any electronic storage media in whole or in part is prohibited under penalty of law, provided that you may download tastylive’s podcasts as necessary to view for personal use. tastylive was previously known as tastytrade, Inc. tastylive is a trademark/servicemark owned by tastylive, Inc.