Technically Speaking, the S&P and Nasdaq 100 are Pointing in This Direction...

Technically Speaking, the S&P and Nasdaq 100 are Pointing in This Direction...
...but the technical outlook on the Russell 2000 is a bit murkier.
- Between June 16 and June 26, /ES and /NQ declined in five of six trading sessions.
- The recent pullbacks in /ES and /NQ produced returns to their one-month moving averages, but technical momentum didn't become outright bearish.
- The rebound in /RTY at former resistance is a positive development for risk appetite broadly.
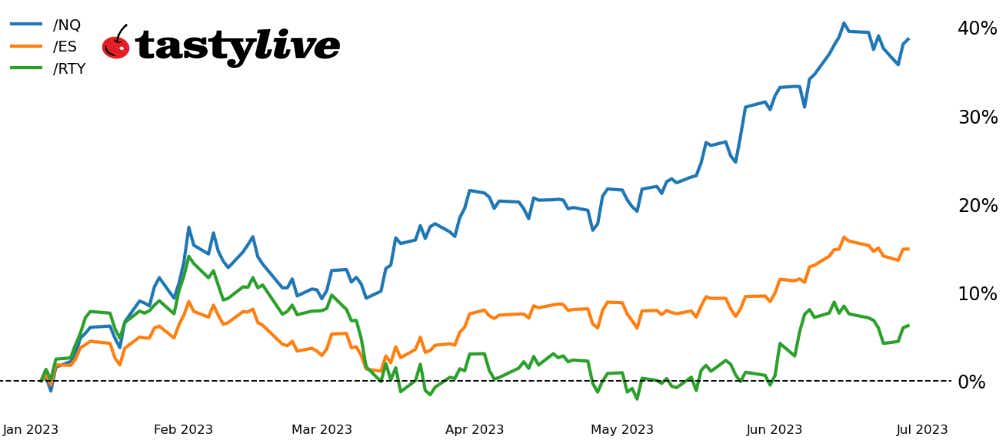
Market update: Nasdaq 100 up +37.67% year-to-date
Despite starting the month with a great deal of uncertainty around a potential U.S. default, U.S. equity markets have produced solid gains throughout June. While a brief setback starting Friday, June 16, tempered gains, constructive price action in this final week of the month has now positioned the S&P 500 (/ES), the Nasdaq 100 (/NQ) and the Russell 2000 (/RTY) on constructive technical footing heading into July.
/ES gold price technical analysis: daily chart (June 2022 to January 2023)
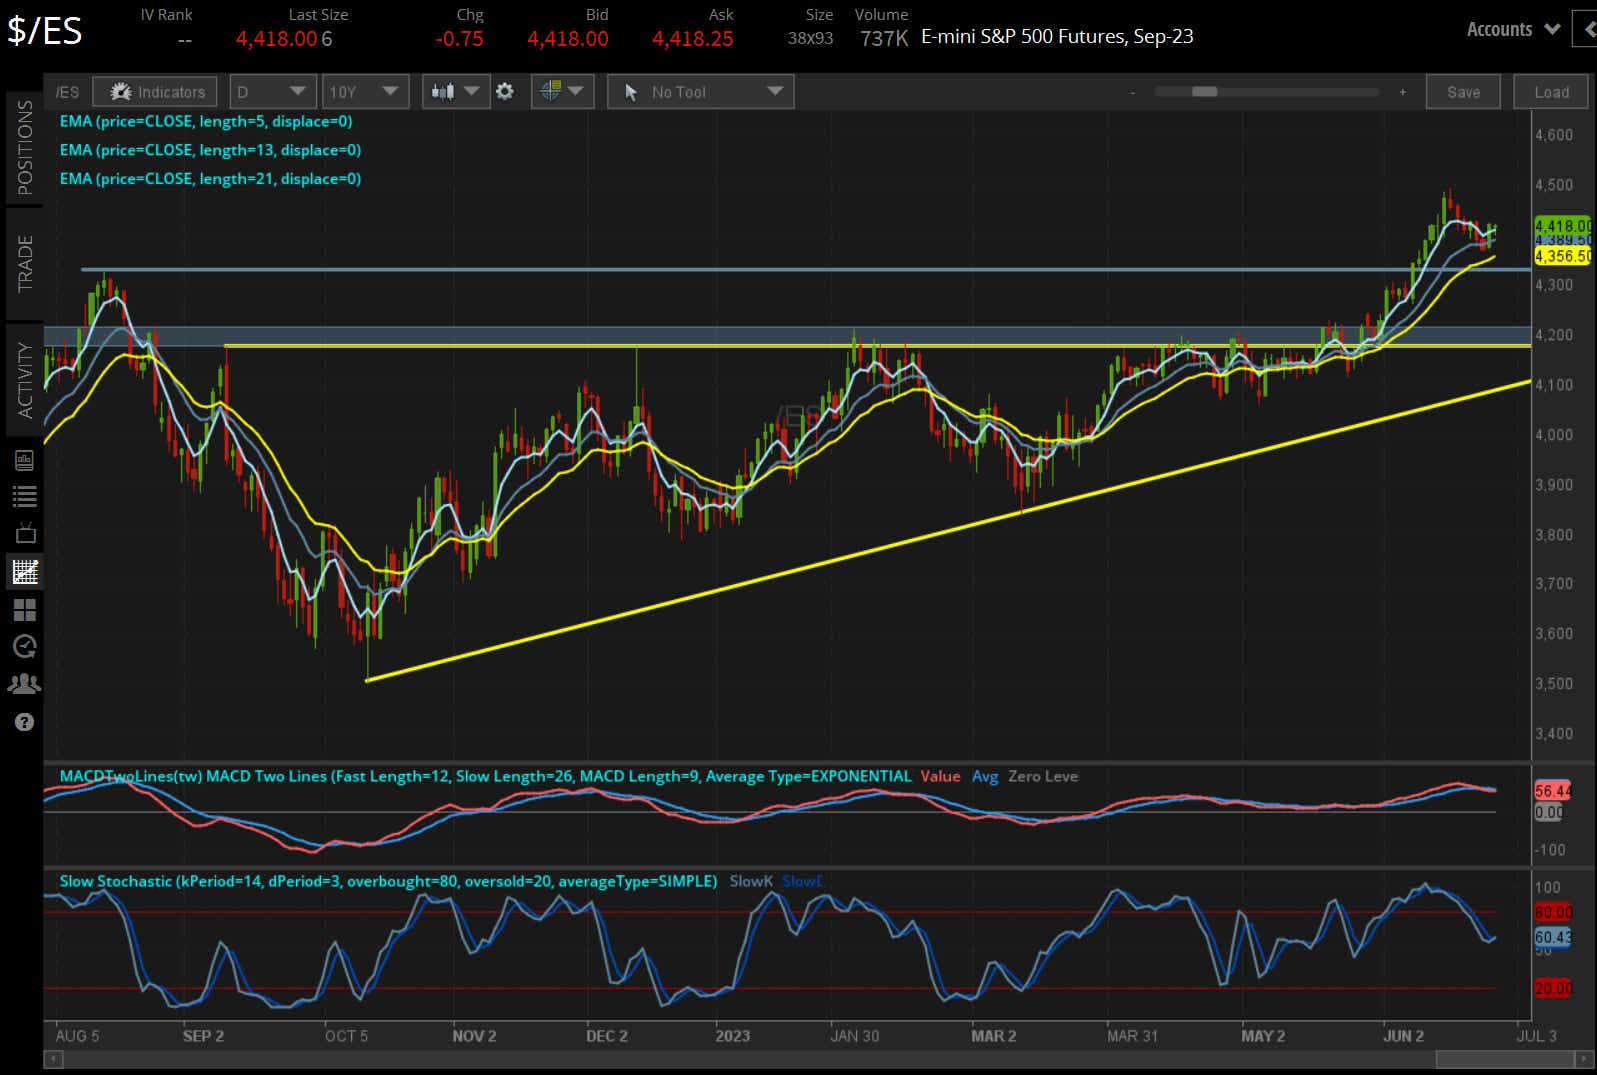
At the start of this month, /ES broke through ascending triangle resistance that has been in place since September 2022. The seeds of the turn higher were planted earlier, however, when /ES closed above its daily 21-EMA (one-month exponential moving average) on May 25. It has not closed below its daily 21-EMA since then.
The pullback seen between June 16 and June 26 did not breach the daily 21-EMA, and momentum indicators did not return to oversold territory, a critical development that would be necessary if the month-long uptrend were to be declared dead. Instead, Slow Stochastics are turning higher while still above their median line, and the moving average convergence/divergence (MACD ) is close to issuing a fresh bullish crossover while about its signal line. With measures of volatility depressed (/ESU3: IV Index – 13.5%; IVR – +2.1) and the technical structure retaining its bullish bias, a return to a through-the-yearly-high of 4493.75 could be achieved by early July.
/NQ gold price technical analysis: daily chart (June 2022 to January 2023)
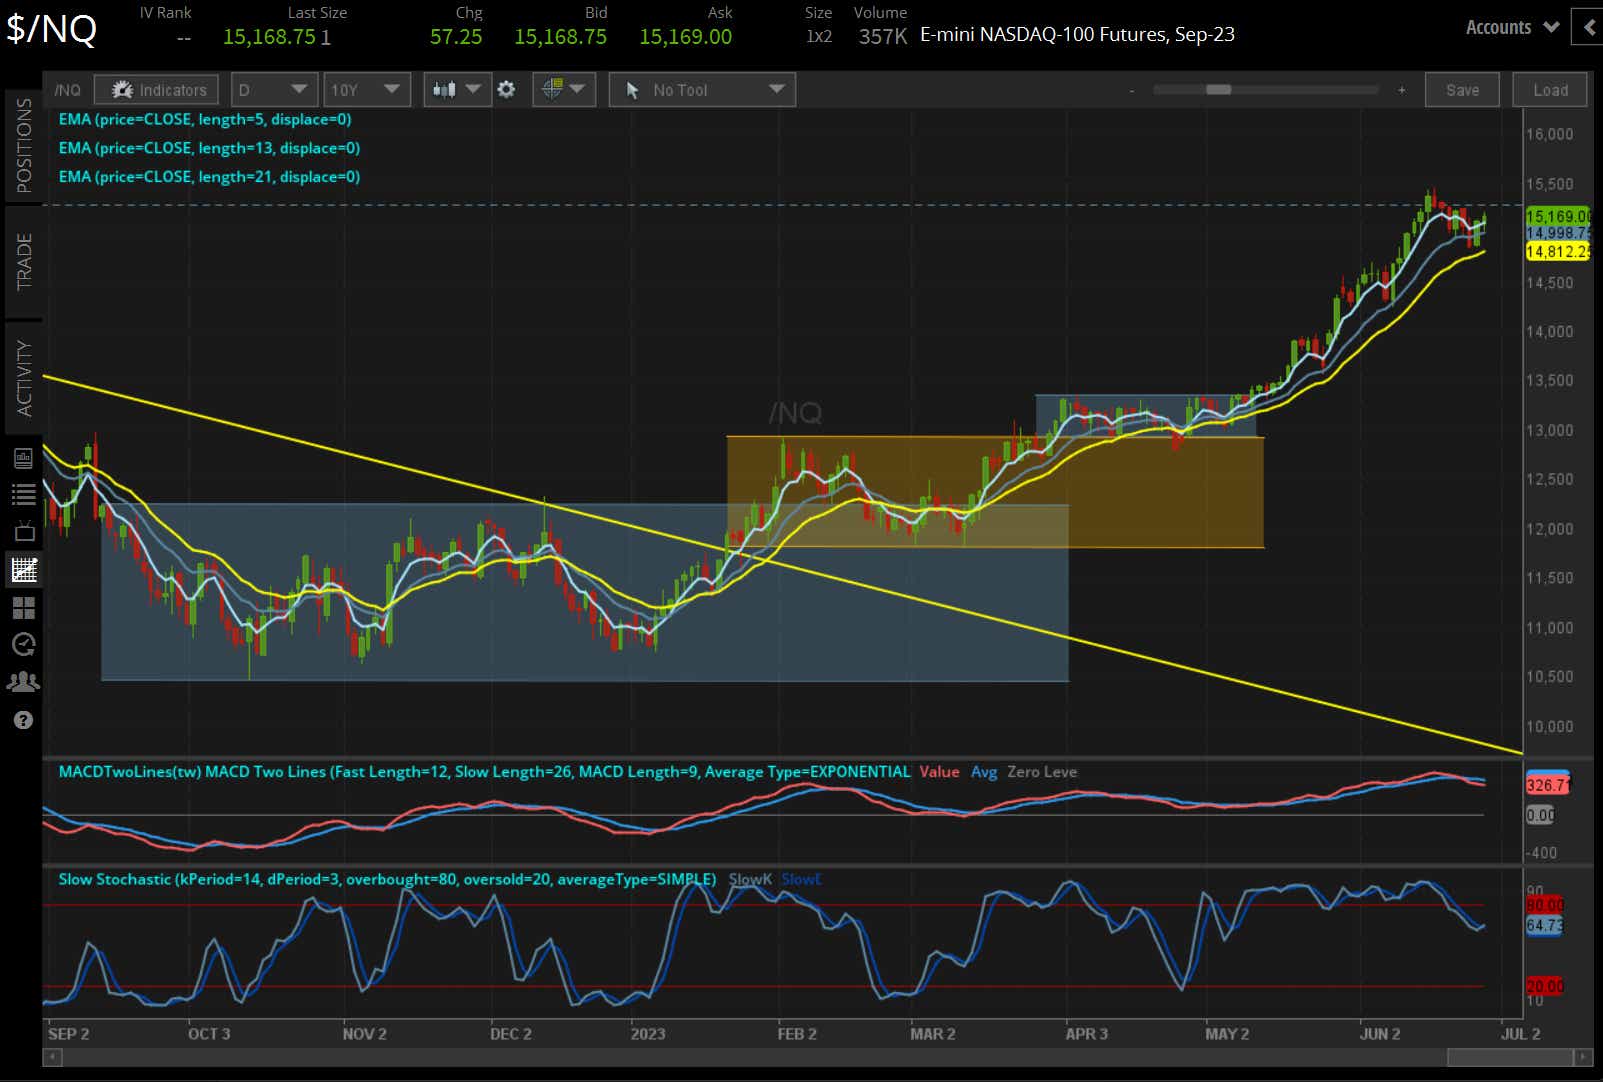
/NQ has had a more consistent bullish momentum profile than either /ES or /RTY, having closed above its daily 21-EMA every session since May 5. Momentum indicators have retained their bullish hue the entirety of this period as well, with MACD holding above its signal line and Slow Stochastics nestled consistently in overbought territory. Like in /ES, Slow Stochastics are now turning higher above their median line, and MACD is on the verge of issuing a bullish crossover while above its signal line. The path of least resistance may prove to be a move back to the yearly high of 15,474.50.
/RTY gold price technical analysis: daily chart (June 2022 to January 2023)
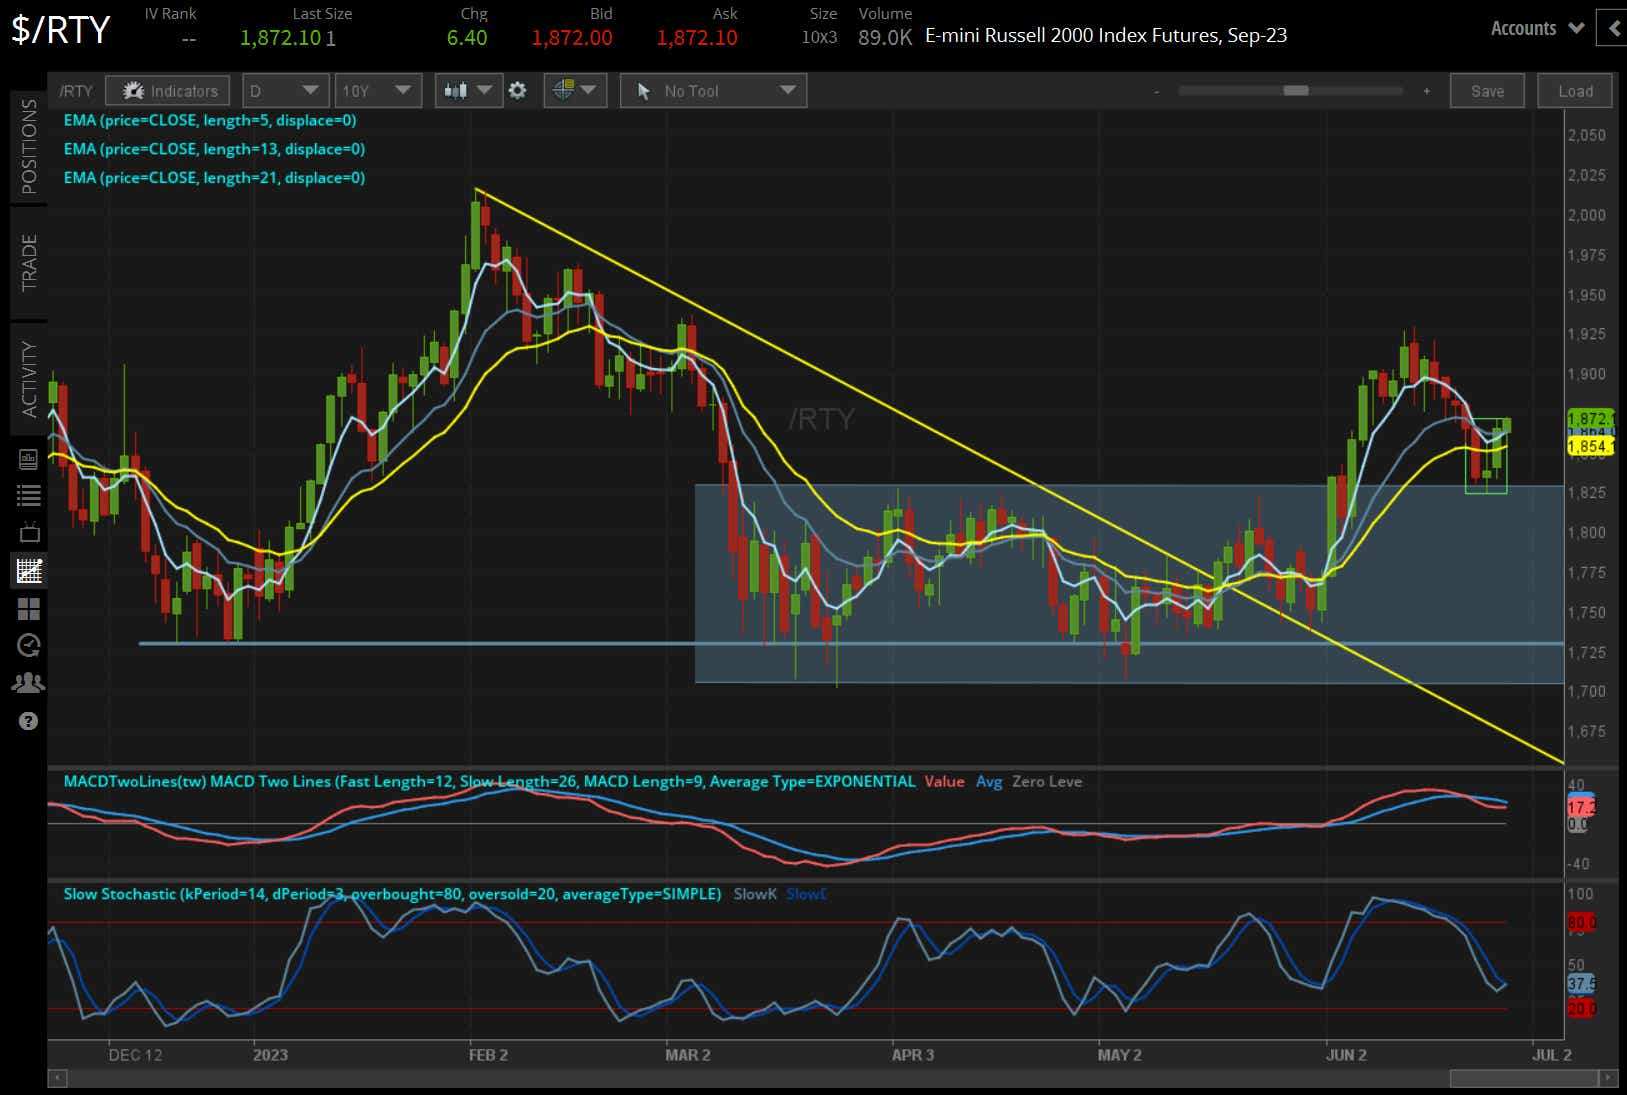
The technical picture is not as clearly bullish for /RTY as it may be for /ES and /NQ, but there has been a meaningful bullish technical development over the past few days which reinforces a belief in improving risk appetite. A morning star candlestick pattern (highlighted from June 23 to 27) is a bottoming pattern, and it developed against the post-SVB range highs near 1830. On a momentum basis, /RTY is clearly lacking. Nevertheless, the charts may be offering an important tell that, if the laggard of 2Q ’23 is able to find some footing, then the leaders may be able to resume their march higher.
Christopher Vecchio, CFA, tastylive’s head of futures and forex, has been trading for nearly 20 years. He has consulted with multi-national firms on FX hedging and lectured at Duke Law School on FX derivatives. Vecchio searches for high-convexity opportunities at the crossroads of macroeconomics and global politics. He hosts Futures Power Hour Monday-Friday and Let Me Explain on Tuesdays, and co-hosts Overtime, Monday-Thursday.
For live daily programming, market news and commentary, visit tastylive or the YouTube channels tastylive (for options traders), and tastyliveTrending for stocks, futures, forex & macro.
Trade with a better broker, open a tastytrade account today. tastylive, Inc. and tastytrade, Inc. are separate but affiliated companies.
Options involve risk and are not suitable for all investors. Please read Characteristics and Risks of Standardized Options before deciding to invest in options.
tastylive content is created, produced, and provided solely by tastylive, Inc. (“tastylive”) and is for informational and educational purposes only. It is not, nor is it intended to be, trading or investment advice or a recommendation that any security, futures contract, digital asset, other product, transaction, or investment strategy is suitable for any person. Trading securities, futures products, and digital assets involve risk and may result in a loss greater than the original amount invested. tastylive, through its content, financial programming or otherwise, does not provide investment or financial advice or make investment recommendations. Investment information provided may not be appropriate for all investors and is provided without respect to individual investor financial sophistication, financial situation, investing time horizon or risk tolerance. tastylive is not in the business of transacting securities trades, nor does it direct client commodity accounts or give commodity trading advice tailored to any particular client’s situation or investment objectives. Supporting documentation for any claims (including claims made on behalf of options programs), comparisons, statistics, or other technical data, if applicable, will be supplied upon request. tastylive is not a licensed financial adviser, registered investment adviser, or a registered broker-dealer. Options, futures, and futures options are not suitable for all investors. Prior to trading securities, options, futures, or futures options, please read the applicable risk disclosures, including, but not limited to, the Characteristics and Risks of Standardized Options Disclosure and the Futures and Exchange-Traded Options Risk Disclosure found on tastytrade.com/disclosures.
tastytrade, Inc. ("tastytrade”) is a registered broker-dealer and member of FINRA, NFA, and SIPC. tastytrade was previously known as tastyworks, Inc. (“tastyworks”). tastytrade offers self-directed brokerage accounts to its customers. tastytrade does not give financial or trading advice, nor does it make investment recommendations. You alone are responsible for making your investment and trading decisions and for evaluating the merits and risks associated with the use of tastytrade’s systems, services or products. tastytrade is a wholly-owned subsidiary of tastylive, Inc.
tastytrade has entered into a Marketing Agreement with tastylive (“Marketing Agent”) whereby tastytrade pays compensation to Marketing Agent to recommend tastytrade’s brokerage services. The existence of this Marketing Agreement should not be deemed as an endorsement or recommendation of Marketing Agent by tastytrade. tastytrade and Marketing Agent are separate entities with their own products and services. tastylive is the parent company of tastytrade.
tastyfx, LLC (“tastyfx”) is a Commodity Futures Trading Commission (“CFTC”) registered Retail Foreign Exchange Dealer (RFED) and Introducing Broker (IB) and Forex Dealer Member (FDM) of the National Futures Association (“NFA”) (NFA ID 0509630). Leveraged trading in foreign currency or off-exchange products on margin carries significant risk and may not be suitable for all investors. We advise you to carefully consider whether trading is appropriate for you based on your personal circumstances as you may lose more than you invest.
tastycrypto is provided solely by tasty Software Solutions, LLC. tasty Software Solutions, LLC is a separate but affiliate company of tastylive, Inc. Neither tastylive nor any of its affiliates are responsible for the products or services provided by tasty Software Solutions, LLC. Cryptocurrency trading is not suitable for all investors due to the number of risks involved. The value of any cryptocurrency, including digital assets pegged to fiat currency, commodities, or any other asset, may go to zero.
© copyright 2013 - 2026 tastylive, Inc. All Rights Reserved. Applicable portions of the Terms of Use on tastylive.com apply. Reproduction, adaptation, distribution, public display, exhibition for profit, or storage in any electronic storage media in whole or in part is prohibited under penalty of law, provided that you may download tastylive’s podcasts as necessary to view for personal use. tastylive was previously known as tastytrade, Inc. tastylive is a trademark/servicemark owned by tastylive, Inc.
Your privacy choices