A Near Perfect Diamond Has Our Resident Technician Eyeing an Imminent Trend Reversal

A Near Perfect Diamond Has Our Resident Technician Eyeing an Imminent Trend Reversal
By:Tim Knight
XLU: Utilities may be repeating history
- A diamond top formation is a technical analysis pattern that can signal the potential reversal of an uptrend.
- XLU's present top is a diamond
- The upshot XLU's technical patterns were incredibly prescient about the bear market of 2008.
I have had good experiences in the past with the Utilities Select Sector SPDR Fund (XLU), and I have been taken in by its well-formed diamond pattern. Indeed, this is one of the cleanest diamond patterns I’ve ever seen. Unlike my other positions, which expire next January, February and even March, this one is relatively short-dated at September, so I certainly hope this pans out in a timely fashion!
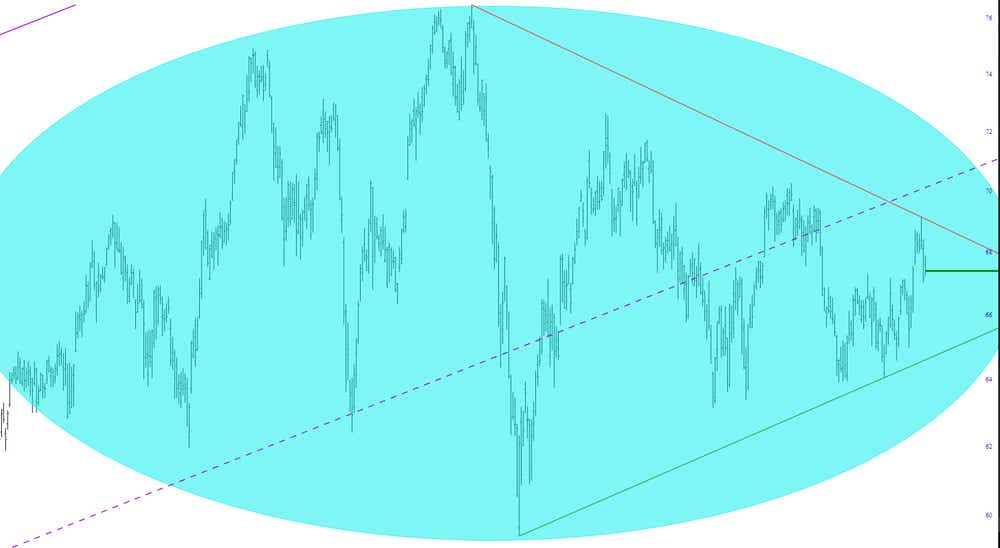
In the chart above, I have tinted out the price zone I consider to be the diamond pattern, and I have added a supporting and resisting trendline on the right of the pattern to make plain what the key “breaks” would be.
Somewhat lacking
Now, we all know XLU doesn’t have the appeal of, let’s say, Invesco QQQ Trust Series 1 (QQQ) or VanEck Semiconductor ETF (SMH), but that’s part of the reason I’m drawn to it. As I am typing these words, for instance, the Nasdaq (/NQ) futures are up literally over 300 points, and equity futures across the board are up strongly. The Utilities Select Sector SPDR Fund (XLU) is up as well, but merely 0.16%, and it is in my estimation far more prone to a breakdown than its sexier cousins.
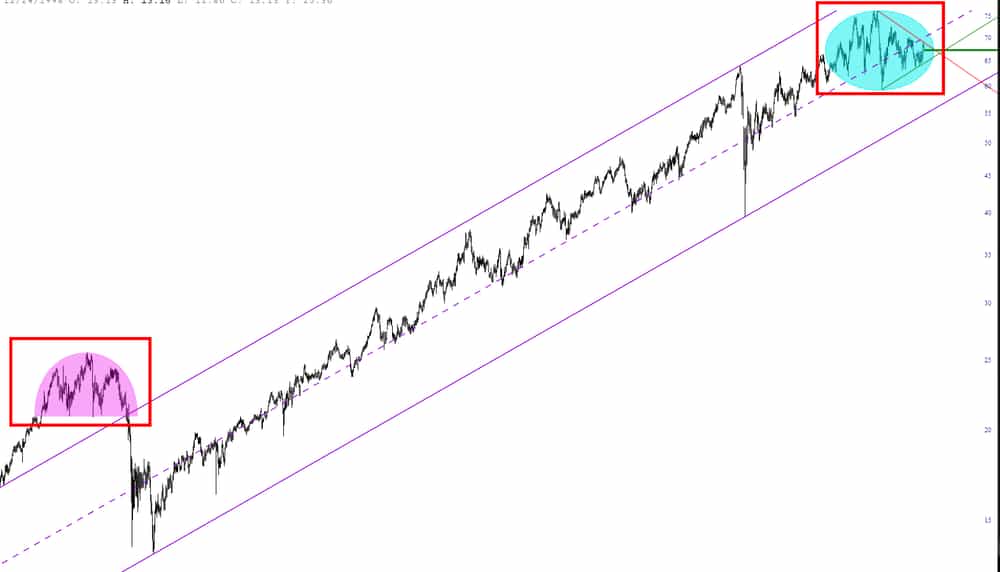
The overarching reason I find XLU so appealing is that it was incredibly prescient about the bear market of 2008. In the chart below, tinted in magenta, you can see the exquisite head and shoulders top that was hammered out before the plunge. The present top, as I’ve noted, is a diamond, but I consider these two reversal patterns to be analogous. It’s particularly intriguing since we have followed the ascending channel so steadily, for a decade and a half, ever since we entered that channel during the throes of the financial crisis.
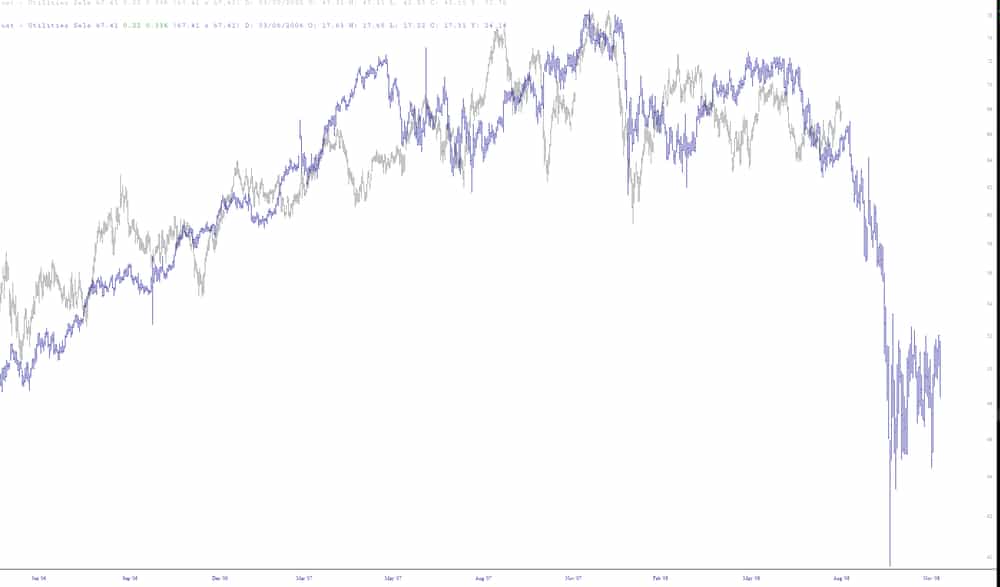
Just to drive home the “analog” point even more, I used the Layered Chart feature in the SlopeCharts tool to overlay the 2007 price action with the recent activity, and I think you can see what an alluring parallel we have here. The recent data is shown in gray, and the pre-financial crisis top is in blue (which includes part of the hard follow which transpired).
An exciting position
So, I’m pretty excited about this position, not only because it represents an opportunity but also because, if it slips lower, it could be a powerful indication of what's in store for the rest of the equity market.
Tim Knight, a charting analyst with 35 years of trading experience, hosts Trading Charts, a tastylive segment airing Monday-Friday. He founded slopeofhope.com in 2005 and uses it as the basis of his technical charting and analysis. Knight authors The Technician column for Luckbox magazine.
For live daily programming, market news and commentary, visit tastylive or the YouTube channels tastylive (for options traders), and tastyliveTrending for stocks, futures, forex & macro.
Trade with a better broker, open a tastytrade account today. tastylive, Inc. and tastytrade, Inc. are separate but affiliated companies.
Options involve risk and are not suitable for all investors. Please read Characteristics and Risks of Standardized Options before deciding to invest in options.
tastylive content is created, produced, and provided solely by tastylive, Inc. (“tastylive”) and is for informational and educational purposes only. It is not, nor is it intended to be, trading or investment advice or a recommendation that any security, futures contract, digital asset, other product, transaction, or investment strategy is suitable for any person. Trading securities, futures products, and digital assets involve risk and may result in a loss greater than the original amount invested. tastylive, through its content, financial programming or otherwise, does not provide investment or financial advice or make investment recommendations. Investment information provided may not be appropriate for all investors and is provided without respect to individual investor financial sophistication, financial situation, investing time horizon or risk tolerance. tastylive is not in the business of transacting securities trades, nor does it direct client commodity accounts or give commodity trading advice tailored to any particular client’s situation or investment objectives. Supporting documentation for any claims (including claims made on behalf of options programs), comparisons, statistics, or other technical data, if applicable, will be supplied upon request. tastylive is not a licensed financial adviser, registered investment adviser, or a registered broker-dealer. Options, futures, and futures options are not suitable for all investors. Prior to trading securities, options, futures, or futures options, please read the applicable risk disclosures, including, but not limited to, the Characteristics and Risks of Standardized Options Disclosure and the Futures and Exchange-Traded Options Risk Disclosure found on tastytrade.com/disclosures.
tastytrade, Inc. ("tastytrade”) is a registered broker-dealer and member of FINRA, NFA, and SIPC. tastytrade was previously known as tastyworks, Inc. (“tastyworks”). tastytrade offers self-directed brokerage accounts to its customers. tastytrade does not give financial or trading advice, nor does it make investment recommendations. You alone are responsible for making your investment and trading decisions and for evaluating the merits and risks associated with the use of tastytrade’s systems, services or products. tastytrade is a wholly-owned subsidiary of tastylive, Inc.
tastytrade has entered into a Marketing Agreement with tastylive (“Marketing Agent”) whereby tastytrade pays compensation to Marketing Agent to recommend tastytrade’s brokerage services. The existence of this Marketing Agreement should not be deemed as an endorsement or recommendation of Marketing Agent by tastytrade. tastytrade and Marketing Agent are separate entities with their own products and services. tastylive is the parent company of tastytrade.
tastyfx, LLC (“tastyfx”) is a Commodity Futures Trading Commission (“CFTC”) registered Retail Foreign Exchange Dealer (RFED) and Introducing Broker (IB) and Forex Dealer Member (FDM) of the National Futures Association (“NFA”) (NFA ID 0509630). Leveraged trading in foreign currency or off-exchange products on margin carries significant risk and may not be suitable for all investors. We advise you to carefully consider whether trading is appropriate for you based on your personal circumstances as you may lose more than you invest.
tastycrypto is provided solely by tasty Software Solutions, LLC. tasty Software Solutions, LLC is a separate but affiliate company of tastylive, Inc. Neither tastylive nor any of its affiliates are responsible for the products or services provided by tasty Software Solutions, LLC. Cryptocurrency trading is not suitable for all investors due to the number of risks involved. The value of any cryptocurrency, including digital assets pegged to fiat currency, commodities, or any other asset, may go to zero.
© copyright 2013 - 2026 tastylive, Inc. All Rights Reserved. Applicable portions of the Terms of Use on tastylive.com apply. Reproduction, adaptation, distribution, public display, exhibition for profit, or storage in any electronic storage media in whole or in part is prohibited under penalty of law, provided that you may download tastylive’s podcasts as necessary to view for personal use. tastylive was previously known as tastytrade, Inc. tastylive is a trademark/servicemark owned by tastylive, Inc.
Your privacy choices