S&P 500 and Nasdaq 100 Stumble Amid Rotation Out of Tech

S&P 500 and Nasdaq 100 Stumble Amid Rotation Out of Tech
The Russell 2000 is having gains on rate-sensitive stocks, while geopolitical tensions are leaving volatility steady
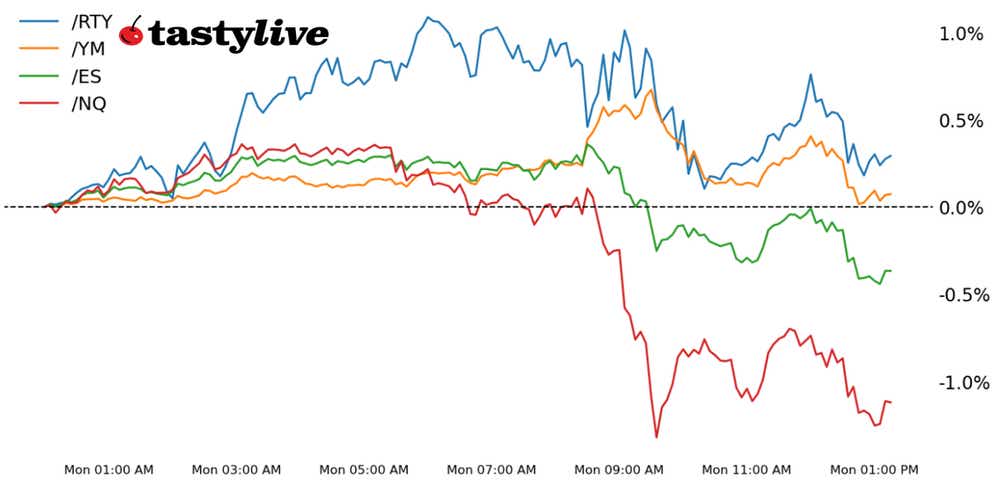
- Both the S&P 500 (/ESU4) and Nasdaq 100 (/NQU4) are pulling back today as traders rotate out of tech stocks.
- The Russell 2000 (/RTYU4) is enjoying increased technical momentum amid a rebalancing to rates-sensitive stocks.
- Geopolitical tensions abroad (Israel-Iran-Hezbollah-Hamas; Libya oil fields closure) are doing little to bother traders at home: Volatility futures (/VXU24) is unchanged from its close on Friday.
Market update: S&P 500 up 1.32% month-to-date
U.S. equity markets are close to closing the book on a dramatic August. The doom and gloom in the first few days of the month has since been replaced by an uneasy sense of cautious optimism. Each of the major U.S. equity indexes are but a few percent off their yearly and all-time highs—at least in the case of the S&P 500 and Nasdaq 100.
The pullback on today may not be worth writing home about: The equal-weighted S&P 500 (RSP) hit a new all-time high today, while the Russell 2000 is the leader on the session. Light volume at the start of the week is being accompanied by garden variety rotation out of mega cap tech and into rates-sensitive laggards. Of course, trading in the first half of this week—the last week of summer—may be mere window dressing ahead of the Nvidia (NVDA) earnings report on Wednesday after the close.
/ES S&P 500 Price Technical Analysis: Daily Chart (August 2023 to August 2024)
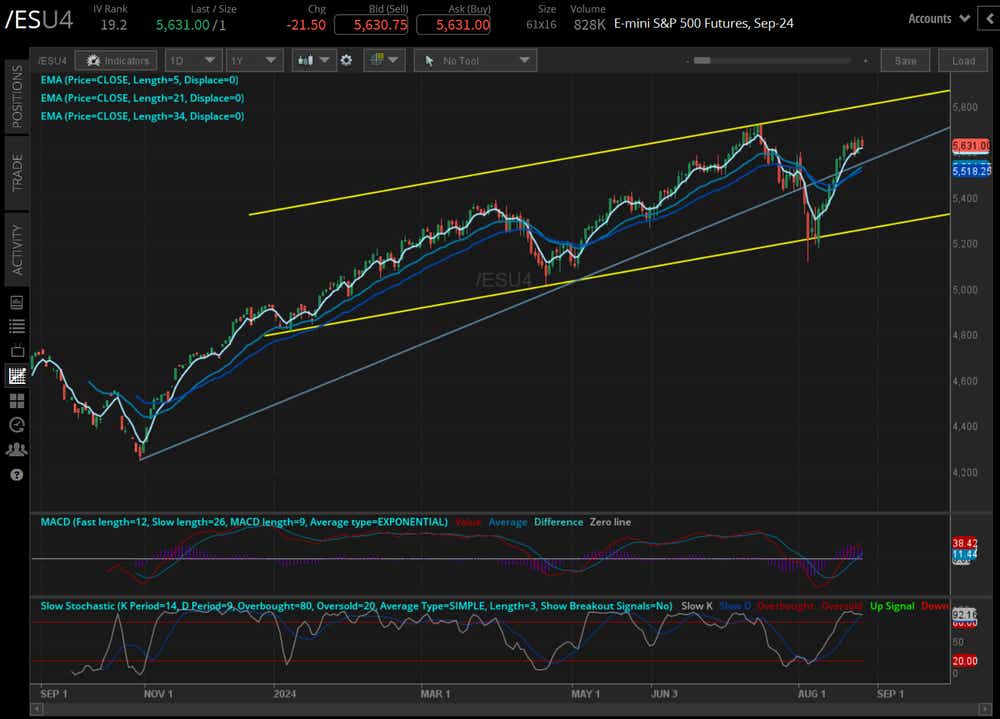
The S&P 500 (/ESU4) is trading above its daily 5-EMA (exponential moving average), daily 21-EMA and daily 34-EMA; The EMAs are in bullish sequential order. Slow stochastics are trending higher into overbought condition, a positive sign for momentum. MACD is trending higher through its signal line. Volatility has come down and remained lower (IVR: 18.7) after its spike early this month. In tandem, the momentum profile and volatility environment are beginning to favor ATM call spreads in /ESU4 (as opposed to short put spreads) to express a bullish bias.
/NQ Nasdaq 100 Price Technical Analysis: Daily Chart (September 2023 to August 2024)
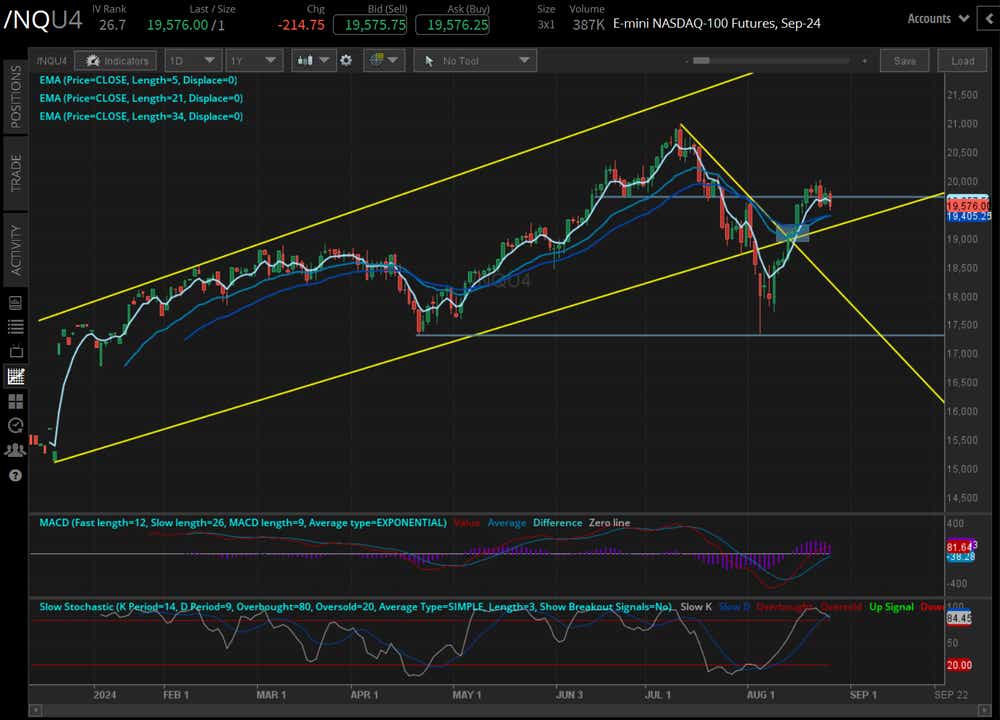
The Nasdaq 100 (/NQU4) has a less bullish outlook than /ESU4. /NQU4 is trading below its daily 5-EMA but above its daily 21- and 34-EMAs; the daily 5-EMA has a negative slope, suggesting short-term bullish momentum has been lost. Slow stochastics have issued a bearish crossover and may be nearing an exit from overbought territory. MACD’s (moving average convergence/divergence) move through its signal line is slowing. The mixed technical picture favors range trading against the July highs and the August lows, although the volatility profile (IVR: 26.7) may not make iron condors or short strangles particularly viable.
/RTY Russell 2000 Price Technical Analysis: Daily Chart (March to August 2024)
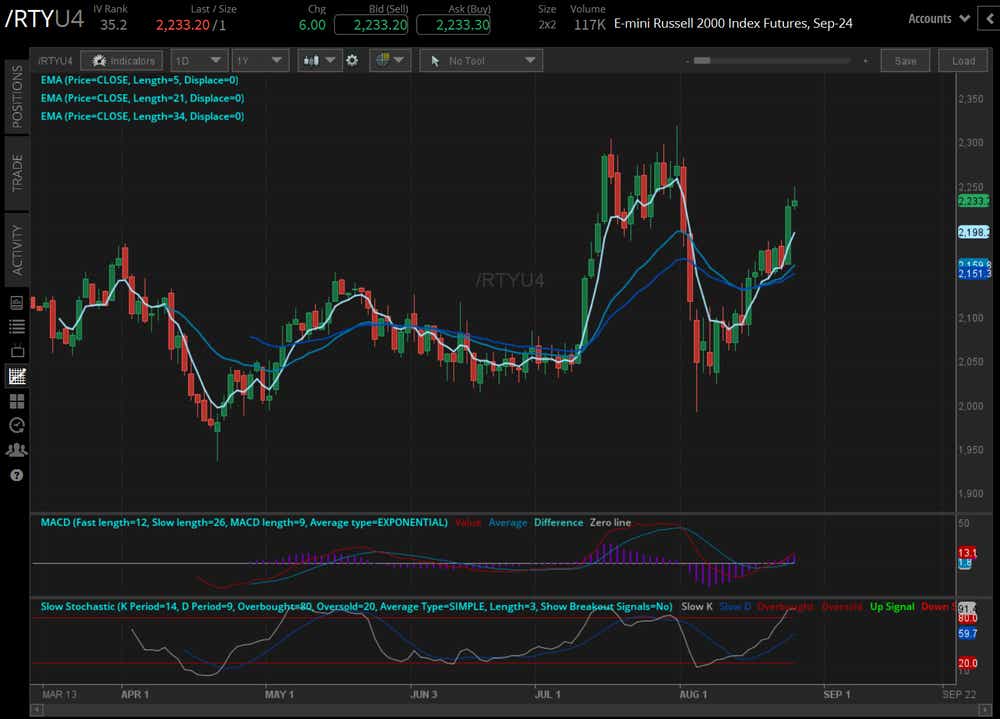
The Russell 2000 (/RTYU4) holds the title of the most bullish technical setup in the short-term. /RTYU4 is trading above its daily 5-EMA, daily 21-EMA and daily 34-EMA; The EMAs are in bullish sequential order, and their respective slopes are increasing. Slow stochastics are trending higher into overbought condition, while MACD is trending higher through its signal line. Volatility remains elevated (IVR: 35.2) compared to its peers, making both iron condors and short put spreads viable strategies in the short-term.
Christopher Vecchio, CFA, tastylive’s head of futures and forex, has been trading for nearly 20 years. He has consulted with multinational firms on FX hedging and lectured at Duke Law School on FX derivatives. Vecchio searches for high-convexity opportunities at the crossroads of macroeconomics and global politics. He hosts Futures Power Hour Monday-Friday and Let Me Explain on Tuesdays, and co-hosts Overtime, Monday-Thursday. @cvecchiofx
For live daily programming, market news and commentary, visit tastylive or the YouTube channels tastylive (for options traders), and tastyliveTrending for stocks, futures, forex & macro.
Trade with a better broker, open a tastytrade account today. tastylive, Inc. and tastytrade, Inc. are separate but affiliated companies.
Options involve risk and are not suitable for all investors. Please read Characteristics and Risks of Standardized Options before deciding to invest in options.
tastylive content is created, produced, and provided solely by tastylive, Inc. (“tastylive”) and is for informational and educational purposes only. It is not, nor is it intended to be, trading or investment advice or a recommendation that any security, futures contract, digital asset, other product, transaction, or investment strategy is suitable for any person. Trading securities, futures products, and digital assets involve risk and may result in a loss greater than the original amount invested. tastylive, through its content, financial programming or otherwise, does not provide investment or financial advice or make investment recommendations. Investment information provided may not be appropriate for all investors and is provided without respect to individual investor financial sophistication, financial situation, investing time horizon or risk tolerance. tastylive is not in the business of transacting securities trades, nor does it direct client commodity accounts or give commodity trading advice tailored to any particular client’s situation or investment objectives. Supporting documentation for any claims (including claims made on behalf of options programs), comparisons, statistics, or other technical data, if applicable, will be supplied upon request. tastylive is not a licensed financial adviser, registered investment adviser, or a registered broker-dealer. Options, futures, and futures options are not suitable for all investors. Prior to trading securities, options, futures, or futures options, please read the applicable risk disclosures, including, but not limited to, the Characteristics and Risks of Standardized Options Disclosure and the Futures and Exchange-Traded Options Risk Disclosure found on tastytrade.com/disclosures.
tastytrade, Inc. ("tastytrade”) is a registered broker-dealer and member of FINRA, NFA, and SIPC. tastytrade was previously known as tastyworks, Inc. (“tastyworks”). tastytrade offers self-directed brokerage accounts to its customers. tastytrade does not give financial or trading advice, nor does it make investment recommendations. You alone are responsible for making your investment and trading decisions and for evaluating the merits and risks associated with the use of tastytrade’s systems, services or products. tastytrade is a wholly-owned subsidiary of tastylive, Inc.
tastytrade has entered into a Marketing Agreement with tastylive (“Marketing Agent”) whereby tastytrade pays compensation to Marketing Agent to recommend tastytrade’s brokerage services. The existence of this Marketing Agreement should not be deemed as an endorsement or recommendation of Marketing Agent by tastytrade. tastytrade and Marketing Agent are separate entities with their own products and services. tastylive is the parent company of tastytrade.
tastyfx, LLC (“tastyfx”) is a Commodity Futures Trading Commission (“CFTC”) registered Retail Foreign Exchange Dealer (RFED) and Introducing Broker (IB) and Forex Dealer Member (FDM) of the National Futures Association (“NFA”) (NFA ID 0509630). Leveraged trading in foreign currency or off-exchange products on margin carries significant risk and may not be suitable for all investors. We advise you to carefully consider whether trading is appropriate for you based on your personal circumstances as you may lose more than you invest.
tastycrypto is provided solely by tasty Software Solutions, LLC. tasty Software Solutions, LLC is a separate but affiliate company of tastylive, Inc. Neither tastylive nor any of its affiliates are responsible for the products or services provided by tasty Software Solutions, LLC. Cryptocurrency trading is not suitable for all investors due to the number of risks involved. The value of any cryptocurrency, including digital assets pegged to fiat currency, commodities, or any other asset, may go to zero.
© copyright 2013 - 2026 tastylive, Inc. All Rights Reserved. Applicable portions of the Terms of Use on tastylive.com apply. Reproduction, adaptation, distribution, public display, exhibition for profit, or storage in any electronic storage media in whole or in part is prohibited under penalty of law, provided that you may download tastylive’s podcasts as necessary to view for personal use. tastylive was previously known as tastytrade, Inc. tastylive is a trademark/servicemark owned by tastylive, Inc.
Your privacy choices