S&P 500, Nasdaq 100 End Volatile Week on Sour Note

S&P 500, Nasdaq 100 End Volatile Week on Sour Note
We markets saw their first weekly loses since the first week of the year. Inflation data may have dinged confidence but uptrends remain in place.
● U.S. stock markets weathered a deluge of disappointing inflation data in recent days, though late-day losses on Friday eliminated weekly gains for the S&P 500 (/ESH4) and Dow Jones 30 (/YMH4).
● Uptrends in the S&P 500 (/ESH4) and Nasdaq 100 (/NQH4) remain intact.
● The Russell 2000 (/RTYH4) heads into next week in bullish breakout territory.

Market update: S&P 500 up 2.94% month-to-date
The turn through the middle of February produced the first weekly loses for the S&P 500 (/ESH4) and Nasdaq 100 (/NQH4) since the first week of the year. A deluge of inflation data in recent days may have dinged confidence as the odds of a Federal Reserve interest rate cut plummeted, but looking at the technical forest from the trees, not much has changed: Uptrends remain in place.
That said, the second half of February is usually ugly for stocks. Consider that over the past 20 years, the S&P 500 has averaged a -0.1% return for the month, with prices peaking on Feb. 15 before subsiding for the final two weeks of the month. Nvidia (NVDA) earnings next week could prove to be a spark that reframes the AI narrative that has helped propel markets since early 2023.
While conflicting technical developments are beginning to emerge, it’s still too soon to declare game over on uptrends that have defined much of 2024—and effectively the market since the end of October 2023.
/ES S&P 500 Price Technical Analysis: Daily Chart (June 2023 to February 2024)
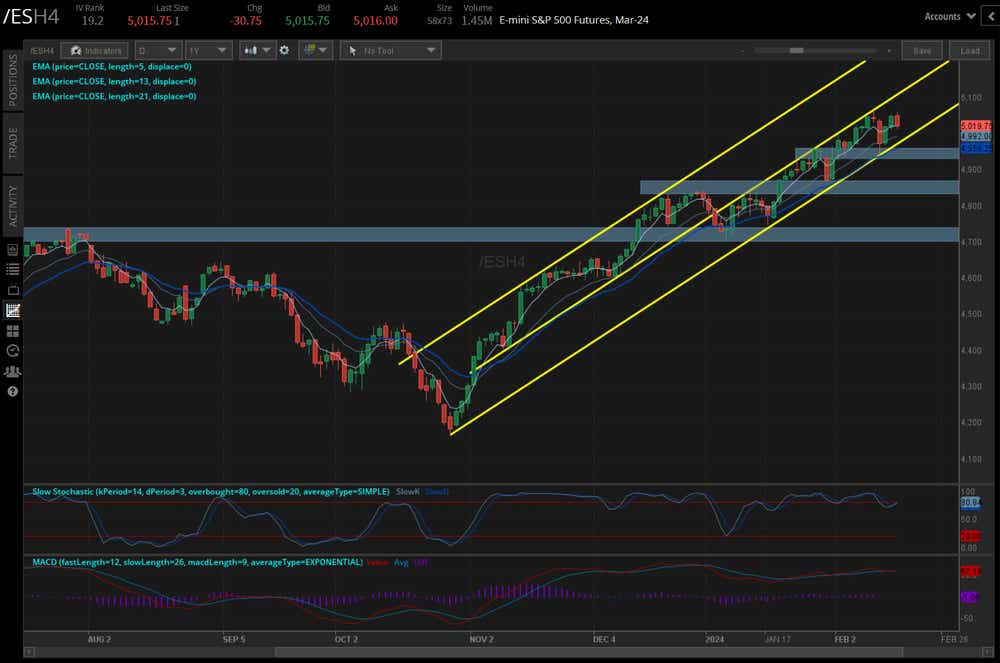
The S&P 500 (/ESH4) traded to unchanged on the week earlier on Friday, before a wave of late-day selling ahead of the holiday weekend kneecapped the rebound. Bullish momentum has eased, but the technical structure remains pointed higher. /ESH4 is above its daily 5-, 13- and 21-exponential moving average (EMA) envelope, which is in bullish sequential order. Slow stochastics are holding just below overbought territory, while MACD is moving sideways while above its signal line.
Could a double top be forming near 5066.50? It’s certainly possible, but one wouldn’t trade around a potential double top pattern until support is broken, which comes at the weekly low at 4936.50. Should 4936.50 break, then the measured move would call for a retracement to 4803.50. Until then, however, the bulls remain in control.
/NQ Nasdaq 100 Price Technical Analysis: Daily Chart (June 2023 to February 2024)

The Nasdaq 100 (/NQH4) offered an ominous signal on Friday, pushing above Thursday’s high while closing below Thursday’s low—a textbook bearish key reversal. This may portend another setback in the coming days. Even so, how deep might that go? /NQH4 remains in the uptrend from the October 2023 and January 2024 lows, and it hasn’t closed below its daily 21-EMA (one-month moving average) since Jan. 5. Before traders can truly start looking lower, breaching both of these is necessary: a symmetrical triangle in the context of a broader uptrend, which is what has formed in recent days, is typically a continuation pattern higher.
/RTY Russell 2000 Price Technical Analysis: Daily Chart (July 2023 to February 2024)
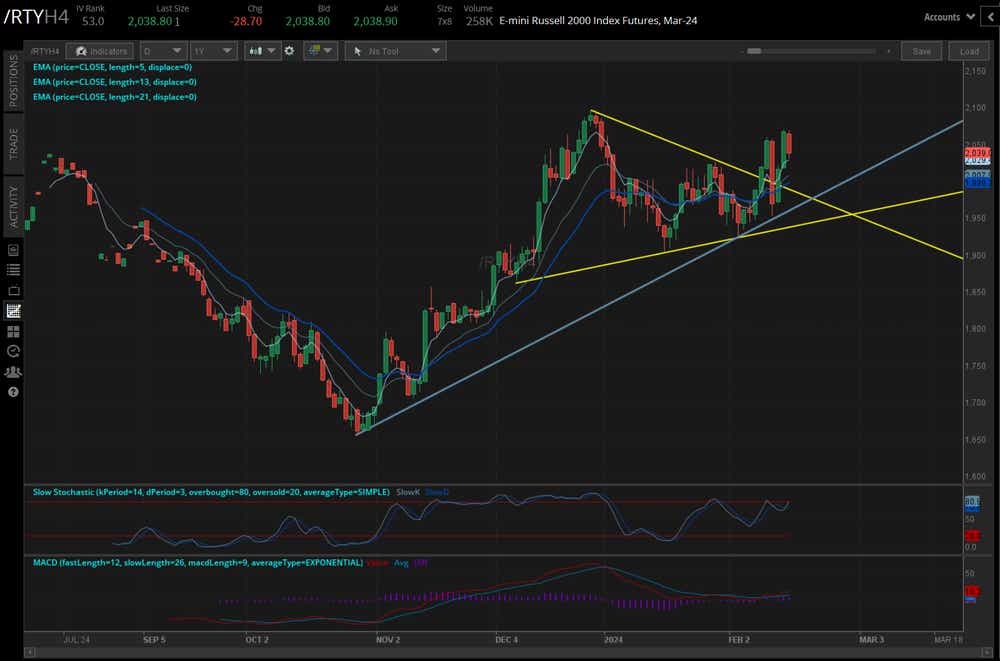
The Russell 2000 (/RTYH4) made a bullish breakout attempt this week in clearing the descending trendline from the December 2023 and January 2024 swing highs. Furthermore, /RTYH4 also cleared out the high in place before the consumer price index (CPI) report on Tuesday, warding off what may have been a 4% move lower off the high. Instead, /RTYH4 may have the cleanest bullish pattern on the board still: It is above its daily EMA envelope (which is in bullish sequential order); Slow stochastics are trending higher into overbought territory; and MACD (moving average convergence/divergence) is still rising while above its signal line. If /RTYH4 is able to retain its bullish breakout stance, it may prove difficult for traders to capitalize on the potential topping efforts present in /ESH4 and /NQH4 heading into next week.
Christopher Vecchio, CFA, tastylive’s head of futures and forex, has been trading for nearly 20 years. He has consulted with multinational firms on FX hedging and lectured at Duke Law School on FX derivatives. Vecchio searches for high-convexity opportunities at the crossroads of macroeconomics and global politics. He hosts Futures Power Hour Monday-Friday and Let Me Explain on Tuesdays, and co-hosts Overtime, Monday-Thursday. @cvecchiofx
For live daily programming, market news and commentary, visit tastylive or the YouTube channels tastylive (for options traders), and tastyliveTrending for stocks, futures, forex & macro.
Trade with a better broker, open a tastytrade account today. tastylive, Inc. and tastytrade, Inc. are separate but affiliated companies.
Options involve risk and are not suitable for all investors. Please read Characteristics and Risks of Standardized Options before deciding to invest in options.
tastylive content is created, produced, and provided solely by tastylive, Inc. (“tastylive”) and is for informational and educational purposes only. It is not, nor is it intended to be, trading or investment advice or a recommendation that any security, futures contract, digital asset, other product, transaction, or investment strategy is suitable for any person. Trading securities, futures products, and digital assets involve risk and may result in a loss greater than the original amount invested. tastylive, through its content, financial programming or otherwise, does not provide investment or financial advice or make investment recommendations. Investment information provided may not be appropriate for all investors and is provided without respect to individual investor financial sophistication, financial situation, investing time horizon or risk tolerance. tastylive is not in the business of transacting securities trades, nor does it direct client commodity accounts or give commodity trading advice tailored to any particular client’s situation or investment objectives. Supporting documentation for any claims (including claims made on behalf of options programs), comparisons, statistics, or other technical data, if applicable, will be supplied upon request. tastylive is not a licensed financial adviser, registered investment adviser, or a registered broker-dealer. Options, futures, and futures options are not suitable for all investors. Prior to trading securities, options, futures, or futures options, please read the applicable risk disclosures, including, but not limited to, the Characteristics and Risks of Standardized Options Disclosure and the Futures and Exchange-Traded Options Risk Disclosure found on tastytrade.com/disclosures.
tastytrade, Inc. ("tastytrade”) is a registered broker-dealer and member of FINRA, NFA, and SIPC. tastytrade was previously known as tastyworks, Inc. (“tastyworks”). tastytrade offers self-directed brokerage accounts to its customers. tastytrade does not give financial or trading advice, nor does it make investment recommendations. You alone are responsible for making your investment and trading decisions and for evaluating the merits and risks associated with the use of tastytrade’s systems, services or products. tastytrade is a wholly-owned subsidiary of tastylive, Inc.
tastytrade has entered into a Marketing Agreement with tastylive (“Marketing Agent”) whereby tastytrade pays compensation to Marketing Agent to recommend tastytrade’s brokerage services. The existence of this Marketing Agreement should not be deemed as an endorsement or recommendation of Marketing Agent by tastytrade. tastytrade and Marketing Agent are separate entities with their own products and services. tastylive is the parent company of tastytrade.
tastyfx, LLC (“tastyfx”) is a Commodity Futures Trading Commission (“CFTC”) registered Retail Foreign Exchange Dealer (RFED) and Introducing Broker (IB) and Forex Dealer Member (FDM) of the National Futures Association (“NFA”) (NFA ID 0509630). Leveraged trading in foreign currency or off-exchange products on margin carries significant risk and may not be suitable for all investors. We advise you to carefully consider whether trading is appropriate for you based on your personal circumstances as you may lose more than you invest.
tastycrypto is provided solely by tasty Software Solutions, LLC. tasty Software Solutions, LLC is a separate but affiliate company of tastylive, Inc. Neither tastylive nor any of its affiliates are responsible for the products or services provided by tasty Software Solutions, LLC. Cryptocurrency trading is not suitable for all investors due to the number of risks involved. The value of any cryptocurrency, including digital assets pegged to fiat currency, commodities, or any other asset, may go to zero.
© copyright 2013 - 2026 tastylive, Inc. All Rights Reserved. Applicable portions of the Terms of Use on tastylive.com apply. Reproduction, adaptation, distribution, public display, exhibition for profit, or storage in any electronic storage media in whole or in part is prohibited under penalty of law, provided that you may download tastylive’s podcasts as necessary to view for personal use. tastylive was previously known as tastytrade, Inc. tastylive is a trademark/servicemark owned by tastylive, Inc.
Your privacy choices