Tops May Be Forming in the S&P 500, Nasdaq 100

Tops May Be Forming in the S&P 500, Nasdaq 100
Market update: The S&P 500 up 0.34% for the month so far
The S&P 500 closed the week flat, and the Nasdaq 100 was off almost 1% while the Russell 2000 dropped almost 2%.
It was the second-worst week of the year for the Nasdaq 100 and Russell 2000 which, alongside S&P 500 is losing uptrends from the October 2023 and February 2024 swing lows.
More–but not much more–technical evidence is needed to suggest that a top has been carved out in U.S. equity indexes.

Persistently hotter than expected inflation data, a turn higher in commodity prices, and a jump in U.S. Treasury yields proved too much for U.S. equity markets to overcome is the calendar turned through the ides of March.
The second-worst week of the year for the Nasdaq 100 (/NQM4) and Russell 2000 (/RTYM4), and the third-worst week of 2024 for the S&P 500 (/ESM4), has produced the first viable technical evidence--at least on a weekly closing basis: Which U.S. equity markets are setting up for a more significant correction?
It's been 86 trading days since /ESM4 has experienced a correction of -2% or more away from a swing high during the uptrend. For all those saying that a correction is overdue, this may finally be the moment!
And yet, the moment has not arrived yet. It may be close, but there are more technical hurdles to clear before we can say with a greater degree of confidence that one of the greatest bull market rallies in U.S. history is coming.
With rate decisions coming from the Bank of Japan (Tuesday), Reserve Bank of Australia (Tuesday), Federal Reserve (Wednesday), and Bank of England (Thursday) next week, traders may not need to wait long for clarification.
/ES S&P 500 price technical analysis: Daily Chart (September 2023 to March 2024)
The S&P 500 (/ESM4) is at support. The uptrend from October 2023 and February 2024 swing lows as well as the daily 21-day exponential moving average (EMA), also called a one-month moving average.
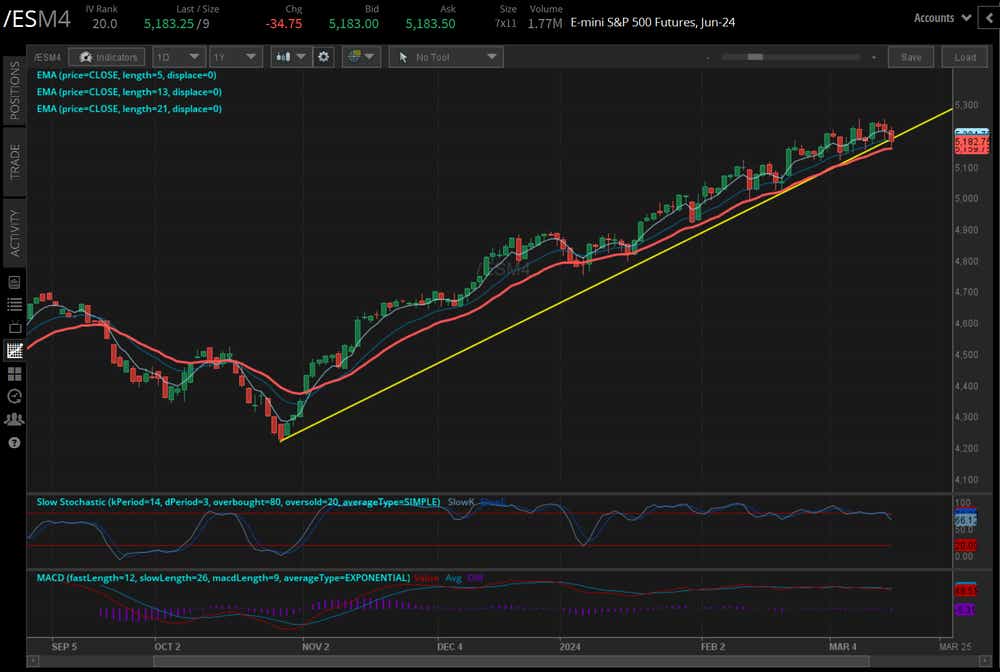
In a bull market, you buy at support. That said, a move below this week’s swing low of 5157 would clear both the uptrend and the monthly EMA, indicating a 100.25-point top may have been carved out; this would suggest a measured move down to 5056.75 as an initial target in any correction.
The bottom line: If you’ve been a bull for the past few months, 5157 is the line in the sand before it’s time to take your ball and go home for the near future.
/NQ Nasdaq 100 Price technical analysis: daily chart(September 2023 to March 2024)
The Nasdaq 100 (/NQM4) may have the most daunting chart, as one could make two bearish cases:
A broadening wedge at the highs, which is a topping pattern (not pictured); or
A bearish rising wedge, which is a significant reversal pattern (pictured below).
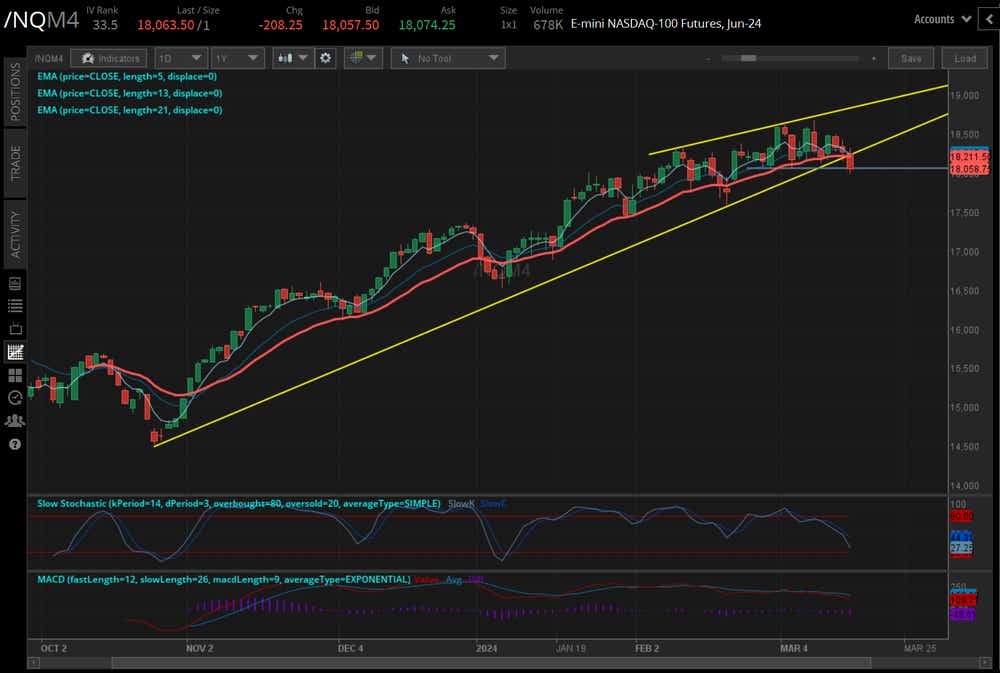
The loss of the uptrend from the October 2023 and February 2024 swing lows is significant, as it the close below the daily 21-day exponential moving average (EMA). The behavior of the momentum indicators is changing, too.
Slow stochastics have moved to their lowest point since the first week of the year. From the first week of the year, slow stochastics moved below their median line just once–ahead of Nvidia (NVDA) earnings–which was quickly negated. 17606.50, the low formed ahead of NVDA earnings, would be the first target lower. A move above 18350 early next week would indicate a false bearish breakdown.
/RTY Russell 2000 price technical analysis: Daily chart (September 2023 to March 2024)
The Russell 2000 (/RTYM4) was plagued by banks this week,. That is, perhaps, coincidence now that the Fed’s Bank Term Funding Program (BTFP) liquidity facility ended on March 11.

Nevertheless, the trappings of a double top are clear, as is the failed breakout of an ascending triangle pattern that now appears to be favoring a downside move: /RTYM4 is now below both the uptrend from the October 2023 and February 2024 lows as well as its daily 21-day EMA (sound familiar?).
More meaningful support may become prevalent at the most recent swing low of 2007. A move above 2090 next week would negate the burgeoning bearish breakout.
Christopher Vecchio, CFA, tastylive’s head of futures and forex, has been trading for nearly 20 years. He has consulted with multinational firms on FX hedging and lectured at Duke Law School on FX derivatives. Vecchio searches for high-convexity opportunities at the crossroads of macroeconomics and global politics. He hosts Futures Power Hour Monday-Friday and Let Me Explain on Tuesdays, and co-hosts Overtime, Monday-Thursday. @cvecchiofx
For live daily programming, market news and commentary, visit tastylive or the YouTube channels tastylive (for options traders), and tastyliveTrending for stocks, futures, forex & macro.
Trade with a better broker, open a tastytrade account today. tastylive, Inc. and tastytrade, Inc. are separate but affiliated companies.
Options involve risk and are not suitable for all investors. Please read Characteristics and Risks of Standardized Options before deciding to invest in options.
tastylive content is created, produced, and provided solely by tastylive, Inc. (“tastylive”) and is for informational and educational purposes only. It is not, nor is it intended to be, trading or investment advice or a recommendation that any security, futures contract, digital asset, other product, transaction, or investment strategy is suitable for any person. Trading securities, futures products, and digital assets involve risk and may result in a loss greater than the original amount invested. tastylive, through its content, financial programming or otherwise, does not provide investment or financial advice or make investment recommendations. Investment information provided may not be appropriate for all investors and is provided without respect to individual investor financial sophistication, financial situation, investing time horizon or risk tolerance. tastylive is not in the business of transacting securities trades, nor does it direct client commodity accounts or give commodity trading advice tailored to any particular client’s situation or investment objectives. Supporting documentation for any claims (including claims made on behalf of options programs), comparisons, statistics, or other technical data, if applicable, will be supplied upon request. tastylive is not a licensed financial adviser, registered investment adviser, or a registered broker-dealer. Options, futures, and futures options are not suitable for all investors. Prior to trading securities, options, futures, or futures options, please read the applicable risk disclosures, including, but not limited to, the Characteristics and Risks of Standardized Options Disclosure and the Futures and Exchange-Traded Options Risk Disclosure found on tastytrade.com/disclosures.
tastytrade, Inc. ("tastytrade”) is a registered broker-dealer and member of FINRA, NFA, and SIPC. tastytrade was previously known as tastyworks, Inc. (“tastyworks”). tastytrade offers self-directed brokerage accounts to its customers. tastytrade does not give financial or trading advice, nor does it make investment recommendations. You alone are responsible for making your investment and trading decisions and for evaluating the merits and risks associated with the use of tastytrade’s systems, services or products. tastytrade is a wholly-owned subsidiary of tastylive, Inc.
tastytrade has entered into a Marketing Agreement with tastylive (“Marketing Agent”) whereby tastytrade pays compensation to Marketing Agent to recommend tastytrade’s brokerage services. The existence of this Marketing Agreement should not be deemed as an endorsement or recommendation of Marketing Agent by tastytrade. tastytrade and Marketing Agent are separate entities with their own products and services. tastylive is the parent company of tastytrade.
tastyfx, LLC (“tastyfx”) is a Commodity Futures Trading Commission (“CFTC”) registered Retail Foreign Exchange Dealer (RFED) and Introducing Broker (IB) and Forex Dealer Member (FDM) of the National Futures Association (“NFA”) (NFA ID 0509630). Leveraged trading in foreign currency or off-exchange products on margin carries significant risk and may not be suitable for all investors. We advise you to carefully consider whether trading is appropriate for you based on your personal circumstances as you may lose more than you invest.
tastycrypto is provided solely by tasty Software Solutions, LLC. tasty Software Solutions, LLC is a separate but affiliate company of tastylive, Inc. Neither tastylive nor any of its affiliates are responsible for the products or services provided by tasty Software Solutions, LLC. Cryptocurrency trading is not suitable for all investors due to the number of risks involved. The value of any cryptocurrency, including digital assets pegged to fiat currency, commodities, or any other asset, may go to zero.
© copyright 2013 - 2026 tastylive, Inc. All Rights Reserved. Applicable portions of the Terms of Use on tastylive.com apply. Reproduction, adaptation, distribution, public display, exhibition for profit, or storage in any electronic storage media in whole or in part is prohibited under penalty of law, provided that you may download tastylive’s podcasts as necessary to view for personal use. tastylive was previously known as tastytrade, Inc. tastylive is a trademark/servicemark owned by tastylive, Inc.
Your privacy choices