Trader Alert: This Market Has Bad Breadth

Trader Alert: This Market Has Bad Breadth
By:Tim Knight
A veteran market technician uses a lesser known charting technique to reveal some disturbing insights
- Ratio charts can clarify value over time.
- The most recent top is not complete and might never be.
- "Magnificent Seven" stocks have been carrying this market higher.
Ratio charts—based on one financial instrument divided by another—result in a line graph that can provide insights that simply aren't possible with other charts. Let's examine nine fascinating ratio charts (sometimes called "pairs" charts) to provide just such a novel perspective.
The first ratio chart shows the FTSE All-World index divided by the continuous contract of gold prices. Why on earth would I choose this goofy combination? Simple: because gold is real money, and representing global equities with real money provides a vastly more realistic (indeed, the only realistic) view of what global equities have done over the decades.
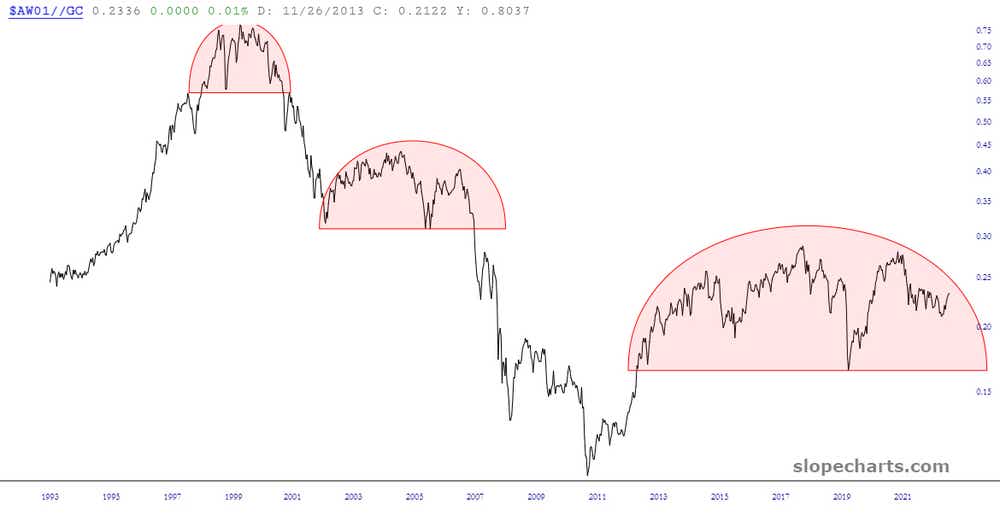
Global stock market used to be more valuable
And what can we conclude from this chart? Well, I see three things right away:
- Over the course of the past 30 years, we've had three major tops.
- The most recent top is not complete (and there's no guarantee it ever will complete), but it's much bigger than the other two.
- Despite the huge bull runs of the housing bubble and the everything bubble, these tops were substantially lower than the Internet bubble. In other words, as measured truthfully, the stock market was much more valuable in the year 2000 than it is right now. I'll say again: the stock market was much (and I mean much) more valuable a quarter century ago. So, when measured by the U.S. dollar, a firm like Nvidia (NVDA) can be in the Trillion Dollar Club, but it doesn't mean quite as much as you might guess.
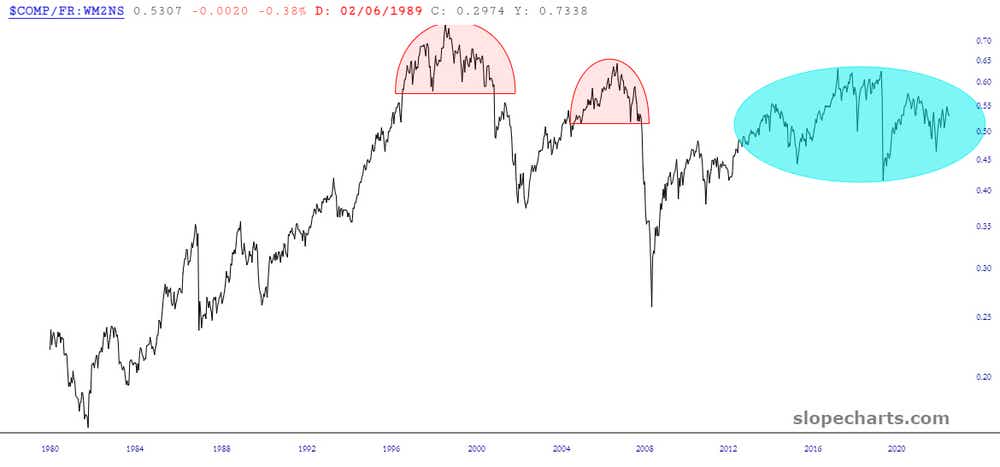
Dow Composite divided by M2
Let's check out those other eight charts, with some commentary beneath each one.
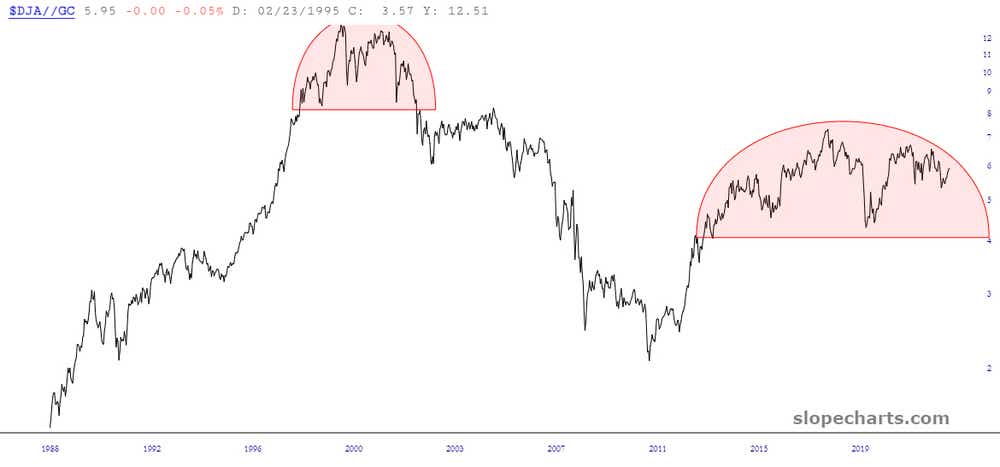
Here we have the Dow Composite divided by M2, the money supply. We see the same three topping patterns here, with the most recent one in the form of a diamond top.
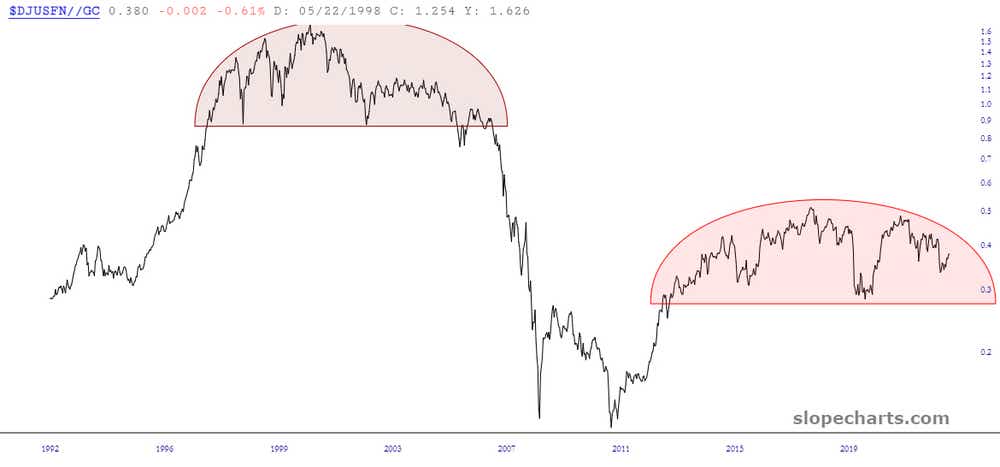
A closer view of the Dow Composite, divided by gold, reveals the most recent top is only about 80% complete (and, keep in mind, has no assurance of ever completing) but is substantially larger than the reversal pattern which preceded it.
Back in March, the Dow Financials took a big hit, thanks to Signature Bank, First Republic Bank and Silicon Valley Bank. But the banks got rescued. The topping pattern is still intact, however, and could become complete in the months ahead.
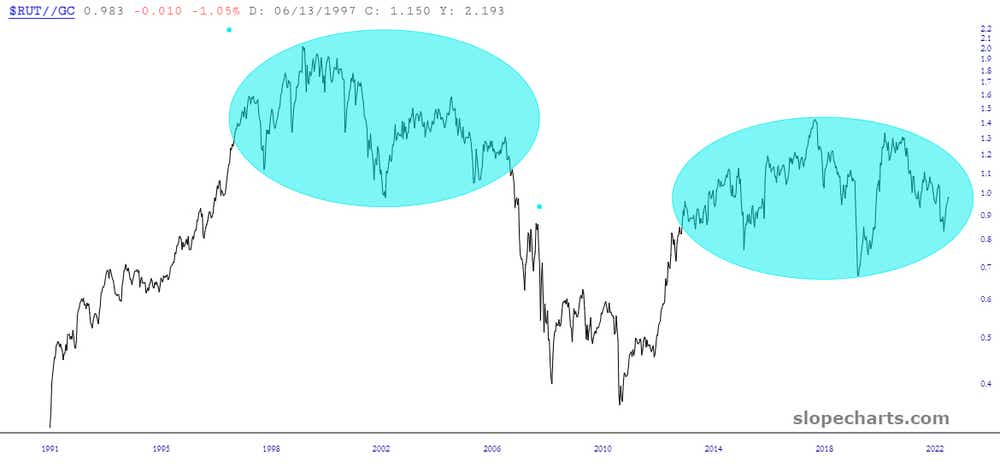
Russell 2000 divided by gold
Small caps (that is, the Russell 2000) divided by gold shows two massive diamond patterns, and the more recent one is cleaner. You can see what followed the completion of the monster top in the late 1990s and early 2000s.
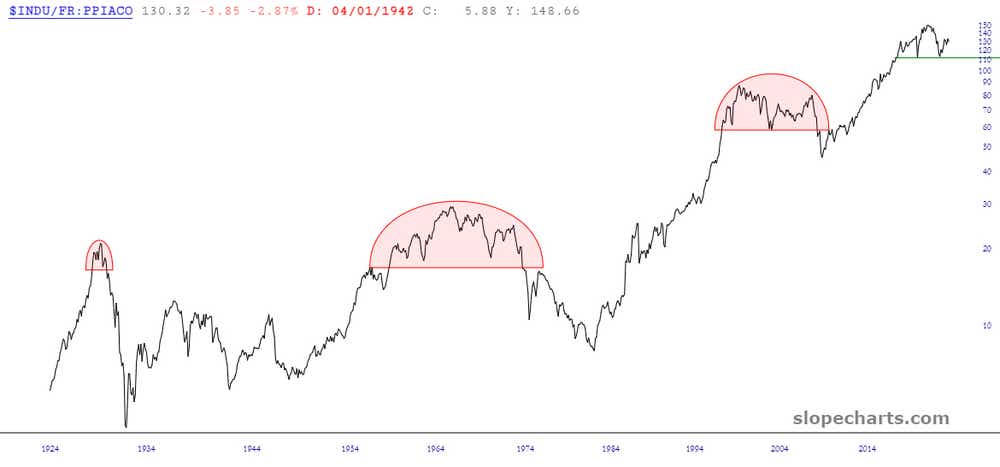
Dow Industrials divided by the PPI and other combos
Most of the charts don't go back this far, but here we see the Dow Industrials divided by the PPI (producer price index) for well over a century. This isn't so much about "real money" as it is taking inflation into account. The largest top preceded the raging inflation of the late 1970s, when equities got destroyed and Business Week published its infamous Death of Equities cover story.
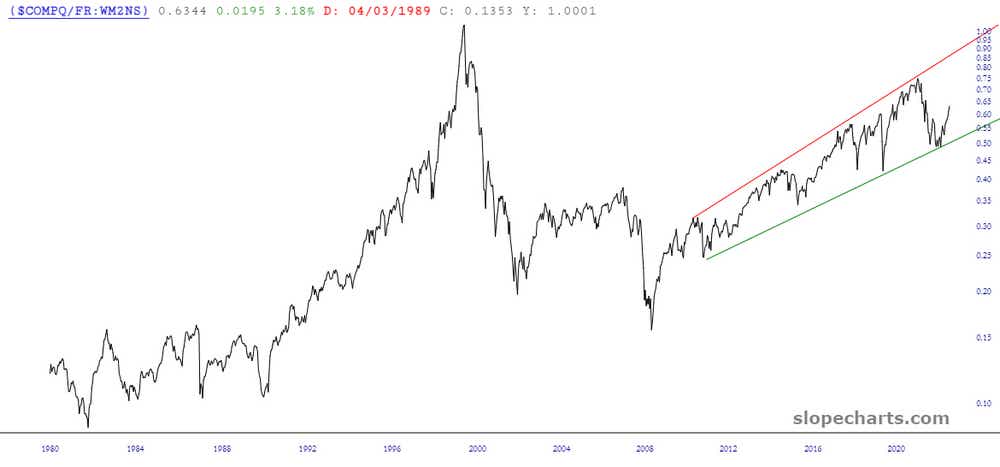
The NASDAQ Composite divided by the M2 illustrates that the tech rally has some real meat on its bones, and it has been rocketing higher in a series of higher highs and higher lows for years now. Take heed of how close we are getting to the valuations of the dot-com bubble. If and when (OK, when) that supporting trendline breaks, look out below.
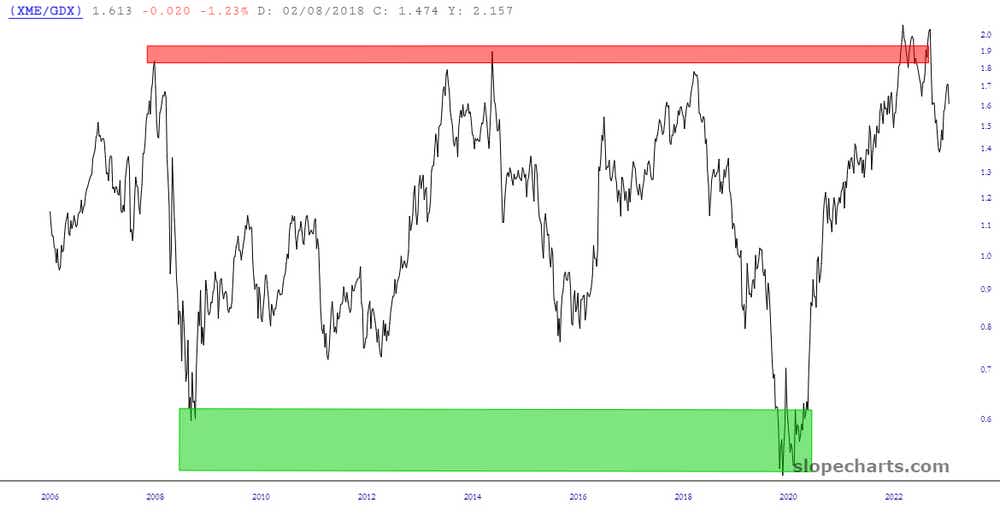
Here's that old chestnut XME divided by GDX, which historically has a huge, clean cycle. XME has already diminished somewhat compared to GDX, but it appears to have a long way to go. (I'm looking at you, Alcoa.)
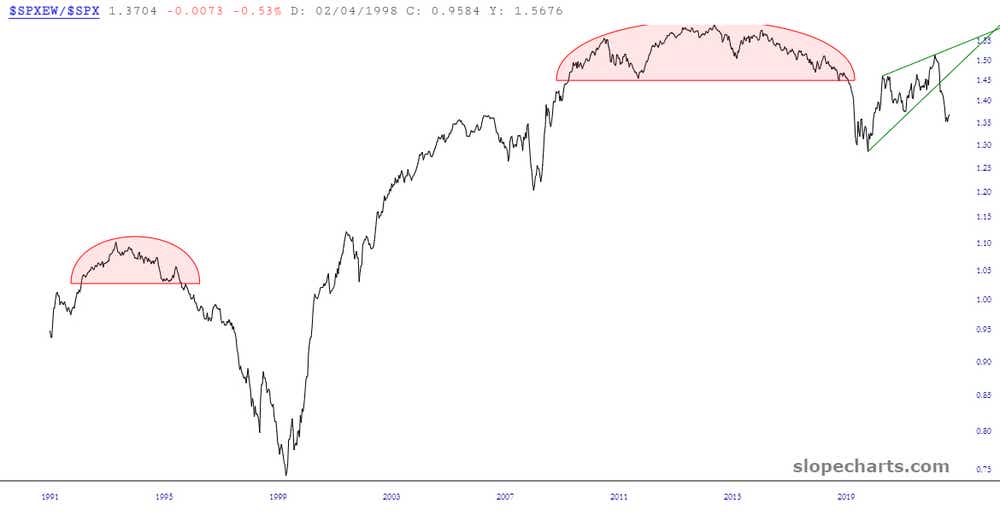
Lastly, and a bit of a shift, here is the equal-weighted S&P 500 divided by the "normal" S&P 500. The fact that the "Magnificent Seven" stocks have been carrying this market higher and the other 493 have been doing very little is quite evident here, as the wedge has been broken hard. We can all agree that breadth in this market absolutely stinks.
Tim Knight, a charting analyst with 35 years of trading experience, hosts Trading Charts, a tastylive segment airing Monday-Friday. He offers his perspective on the latest market activity by way of up-to-date market action. He founded slopeofhope.com in 2005 and uses it as the basis of his charting and analysis.
For live daily programming, market news and commentary, visit tastylive or the YouTube channels tastylive (for options traders), and tastyliveTrending for stocks, futures, forex & macro.
Trade with a better broker, open a tastytrade account today. tastylive, Inc. and tastytrade, Inc. are separate but affiliated companies.
Options involve risk and are not suitable for all investors. Please read Characteristics and Risks of Standardized Options before deciding to invest in options.
tastylive content is created, produced, and provided solely by tastylive, Inc. (“tastylive”) and is for informational and educational purposes only. It is not, nor is it intended to be, trading or investment advice or a recommendation that any security, futures contract, digital asset, other product, transaction, or investment strategy is suitable for any person. Trading securities, futures products, and digital assets involve risk and may result in a loss greater than the original amount invested. tastylive, through its content, financial programming or otherwise, does not provide investment or financial advice or make investment recommendations. Investment information provided may not be appropriate for all investors and is provided without respect to individual investor financial sophistication, financial situation, investing time horizon or risk tolerance. tastylive is not in the business of transacting securities trades, nor does it direct client commodity accounts or give commodity trading advice tailored to any particular client’s situation or investment objectives. Supporting documentation for any claims (including claims made on behalf of options programs), comparisons, statistics, or other technical data, if applicable, will be supplied upon request. tastylive is not a licensed financial adviser, registered investment adviser, or a registered broker-dealer. Options, futures, and futures options are not suitable for all investors. Prior to trading securities, options, futures, or futures options, please read the applicable risk disclosures, including, but not limited to, the Characteristics and Risks of Standardized Options Disclosure and the Futures and Exchange-Traded Options Risk Disclosure found on tastytrade.com/disclosures.
tastytrade, Inc. ("tastytrade”) is a registered broker-dealer and member of FINRA, NFA, and SIPC. tastytrade was previously known as tastyworks, Inc. (“tastyworks”). tastytrade offers self-directed brokerage accounts to its customers. tastytrade does not give financial or trading advice, nor does it make investment recommendations. You alone are responsible for making your investment and trading decisions and for evaluating the merits and risks associated with the use of tastytrade’s systems, services or products. tastytrade is a wholly-owned subsidiary of tastylive, Inc.
tastytrade has entered into a Marketing Agreement with tastylive (“Marketing Agent”) whereby tastytrade pays compensation to Marketing Agent to recommend tastytrade’s brokerage services. The existence of this Marketing Agreement should not be deemed as an endorsement or recommendation of Marketing Agent by tastytrade. tastytrade and Marketing Agent are separate entities with their own products and services. tastylive is the parent company of tastytrade.
tastyfx, LLC (“tastyfx”) is a Commodity Futures Trading Commission (“CFTC”) registered Retail Foreign Exchange Dealer (RFED) and Introducing Broker (IB) and Forex Dealer Member (FDM) of the National Futures Association (“NFA”) (NFA ID 0509630). Leveraged trading in foreign currency or off-exchange products on margin carries significant risk and may not be suitable for all investors. We advise you to carefully consider whether trading is appropriate for you based on your personal circumstances as you may lose more than you invest.
tastycrypto is provided solely by tasty Software Solutions, LLC. tasty Software Solutions, LLC is a separate but affiliate company of tastylive, Inc. Neither tastylive nor any of its affiliates are responsible for the products or services provided by tasty Software Solutions, LLC. Cryptocurrency trading is not suitable for all investors due to the number of risks involved. The value of any cryptocurrency, including digital assets pegged to fiat currency, commodities, or any other asset, may go to zero.
© copyright 2013 - 2026 tastylive, Inc. All Rights Reserved. Applicable portions of the Terms of Use on tastylive.com apply. Reproduction, adaptation, distribution, public display, exhibition for profit, or storage in any electronic storage media in whole or in part is prohibited under penalty of law, provided that you may download tastylive’s podcasts as necessary to view for personal use. tastylive was previously known as tastytrade, Inc. tastylive is a trademark/servicemark owned by tastylive, Inc.
Your privacy choices