Chartmania! These 21 ETFs Are About to Break Out (Or, Are They?)

Chartmania! These 21 ETFs Are About to Break Out (Or, Are They?)
By:Tim Knight
The recent relief rally has lifted 21 ETFs to vitally important zones of resistance. Will they break through? How you perceive these charts depends on your level of bullishness.
The past few days have provided a much-needed relief rally for the entire market. Across a wide span of financial assets, a quick and powerful upsurge has sprung prices from the depths toward what I perceive as vitally important zones of resistance.
These take the form of price gaps, Fibonacci resistance levels or simple horizontal lines, but in each case, it will take very little to complete the trip to these exhaustion zones (or, if you're inclined to be bullish, the same charts show that it wouldn't take very much to violate these levels of resistance and put even more wind into the bullish sails).
Below are 21 exchange-traded funds (ETFs) I believe illustrate this succinctly. I'll share a few words preceding each chart to summarize why it is at a meaningful price juncture.
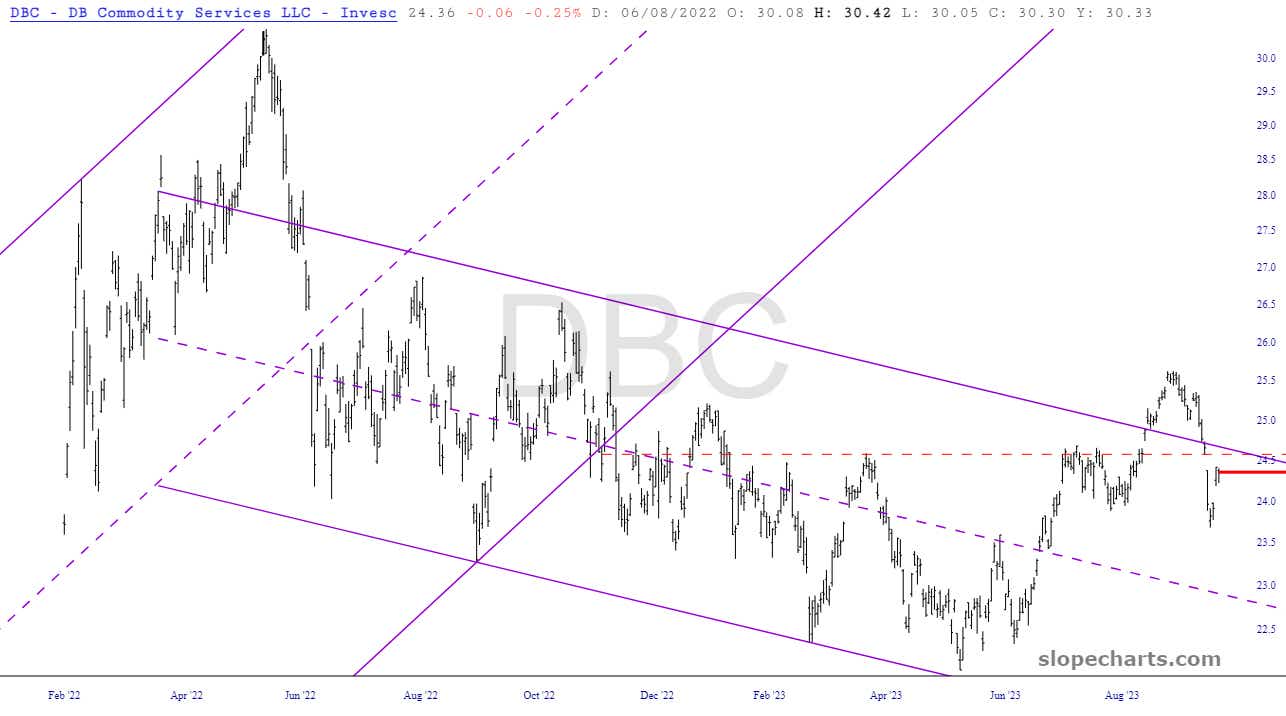
Commodities
We start with the commodities fund—the Invesco DB Commodity Index Tracking Fund (DBC)—which re-penetrated its descending price channel and formed a small, rounded top. The war in Gaza pushed oil prices strongly higher, but the price gap caused between Friday and Monday is close to being sealed. Oil is the biggest component of DBC.
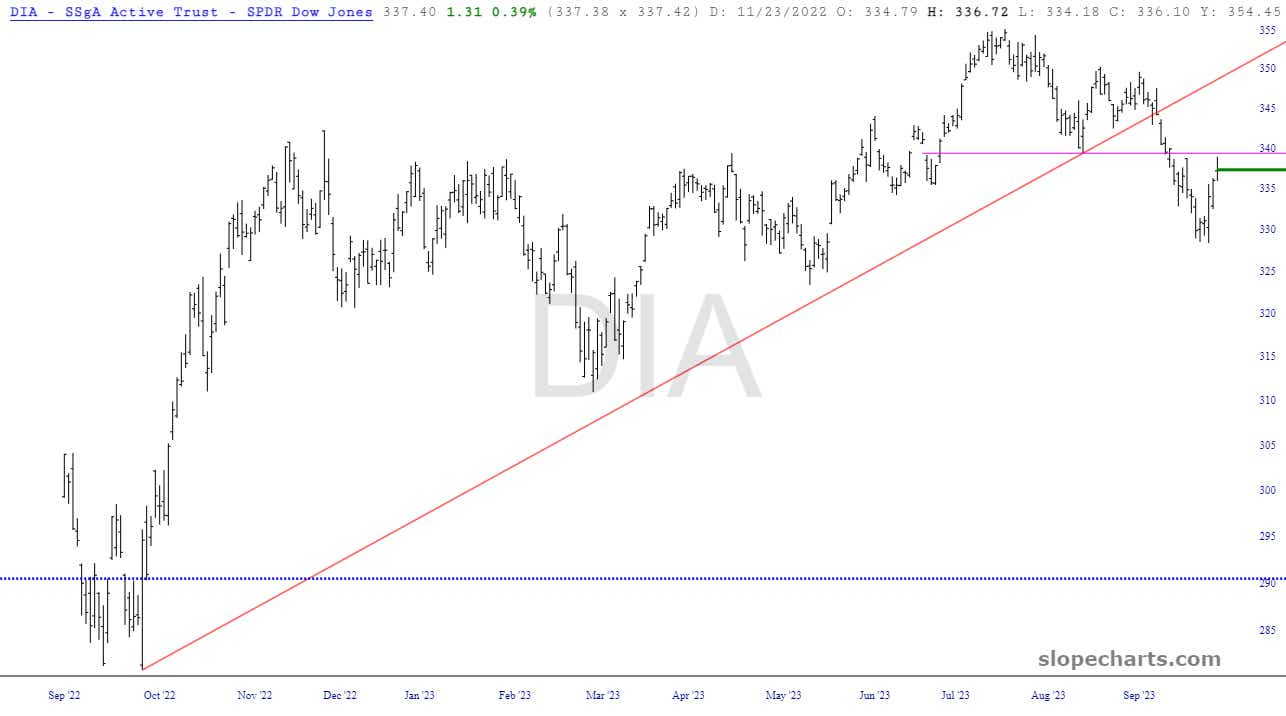
Dow 30 and the EAFE index
The Dow 30 Industrials broke a substantial trendline many weeks ago, and the rally over the course of Friday, Monday, and Tuesday has brought prices back to the horizontal, which is the base of a right triangle top.
Here's a chart showing the performance of the SPDR Dow Jones Industrial Average ETF Trust (DIA).
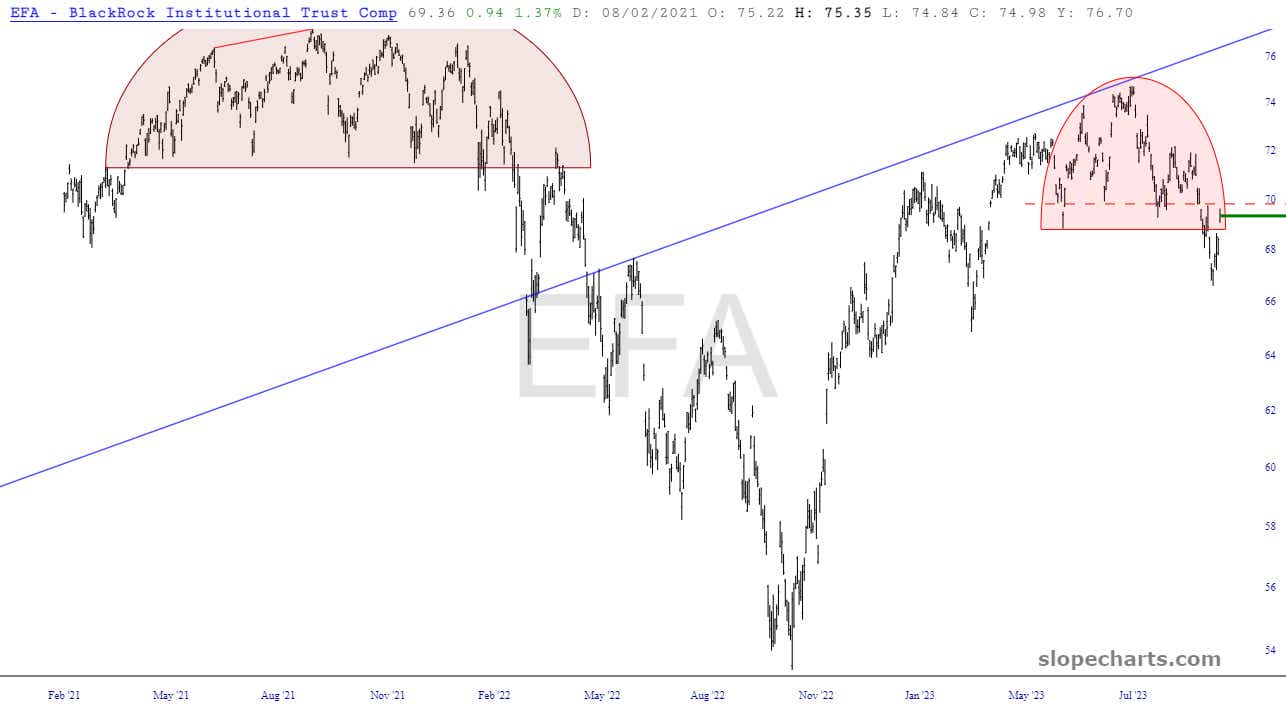
The iShares MSCI EAFE ETF (EFA)—which seeks to track an index composed of large- and mid-capitalization developed market equities, excluding the U.S. and Canada—is particularly impressive. The pink tinted zone constitutes an exceptionally clean head and shoulders topping pattern, and the dashed line represents the neckline. Moreover, this head-and-shoulders top is neatly beneath a massive, failed ascending trendline.
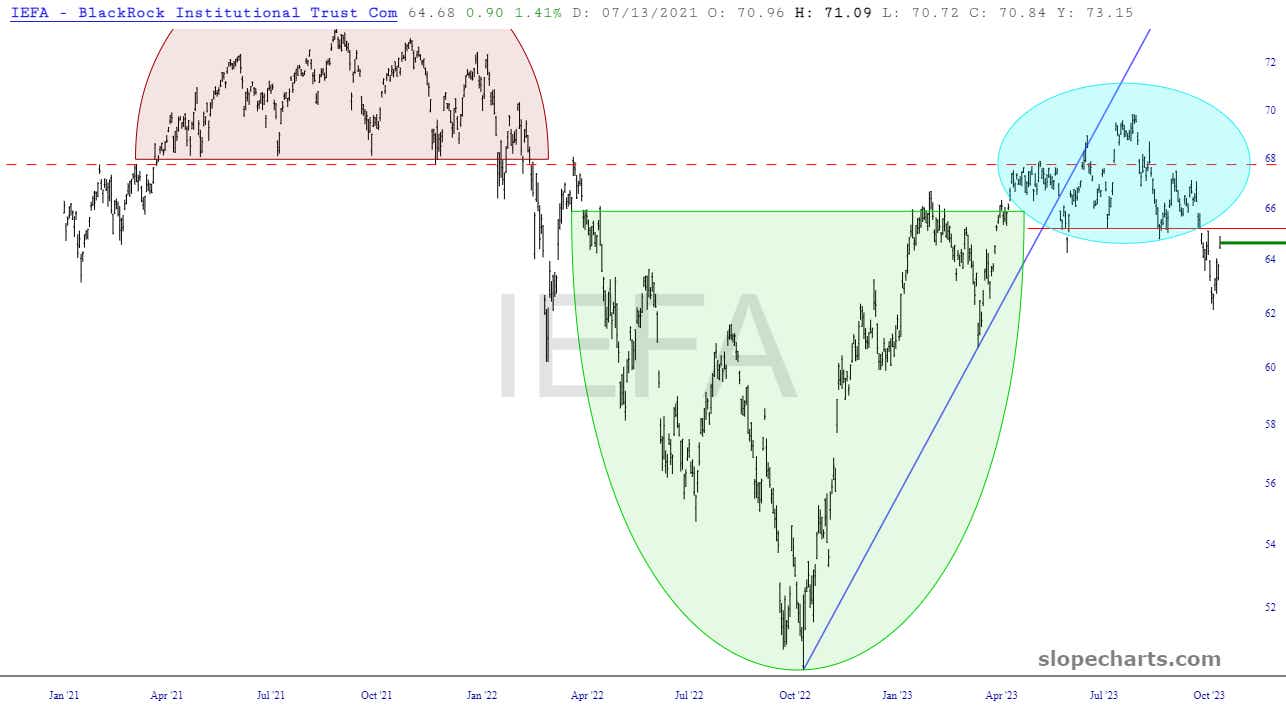
The iShares Core MSCI EAFE ETF (IEFA), which is similarly constituted as the EFA, also has an H&S top, and the light blue tint shows the large area of overhead supply. EAFE stands for Europe, Australasia and the Far East.
Gold and silver
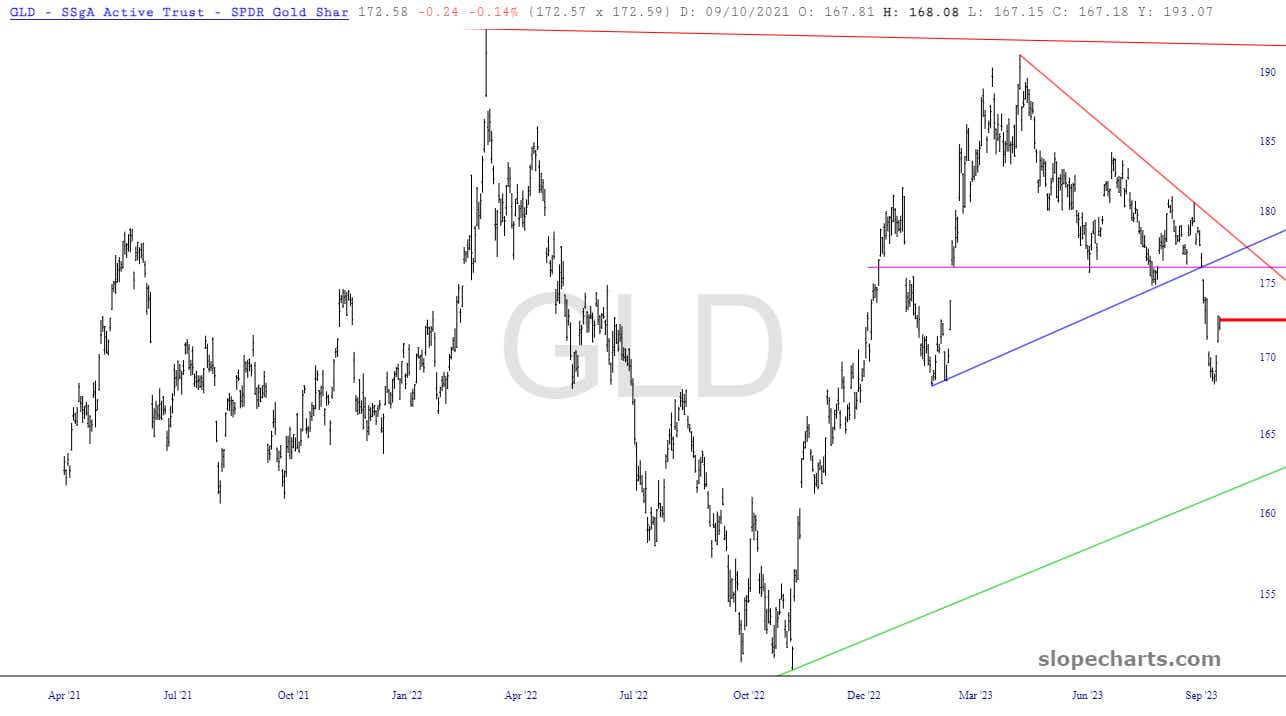
Gold, by way of the SPDR Gold Shares (GLD) fund, broke beneath a symmetric triangle pattern. This might only be about 60% done with its bounce, but firm resistance is represented by both the blue trendline as well as the magenta-colored horizontal.
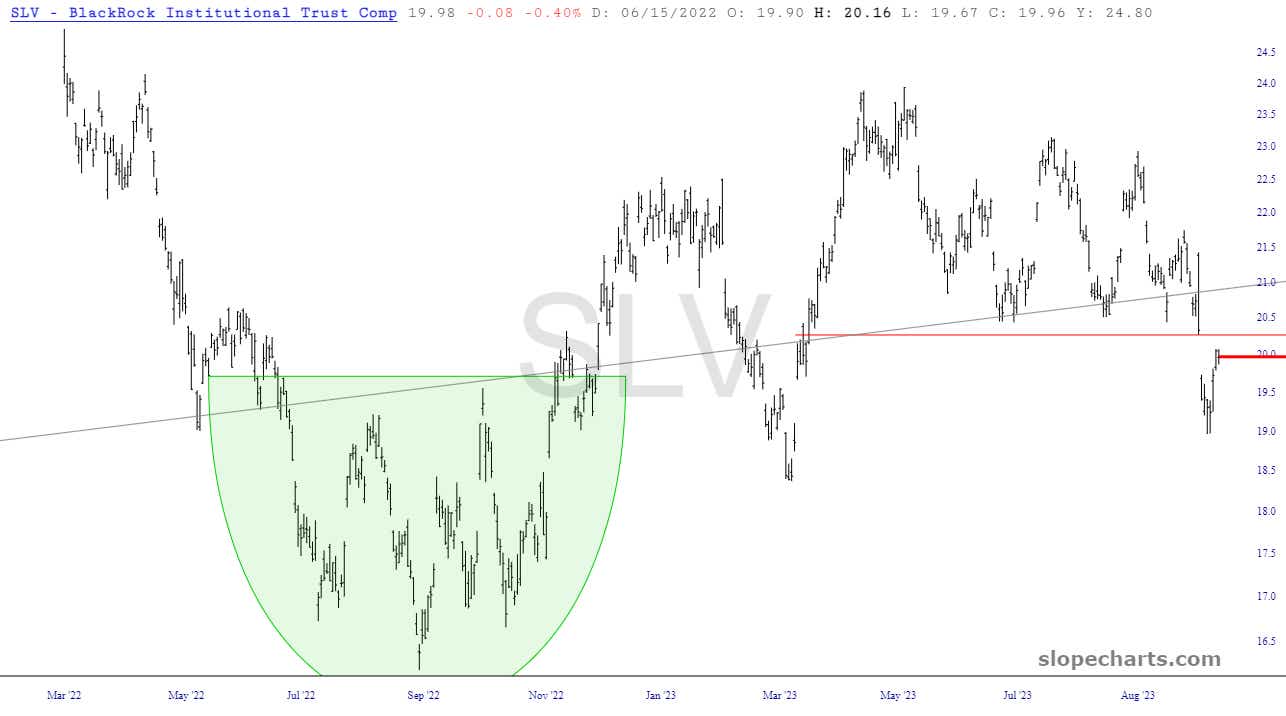
The iShares Silver Trust (SLV) has been weak for almost the entirety of 2023, and it is just beneath a price gap that should prove to be a strong limit to any further recovery bounce.
Homebuilders
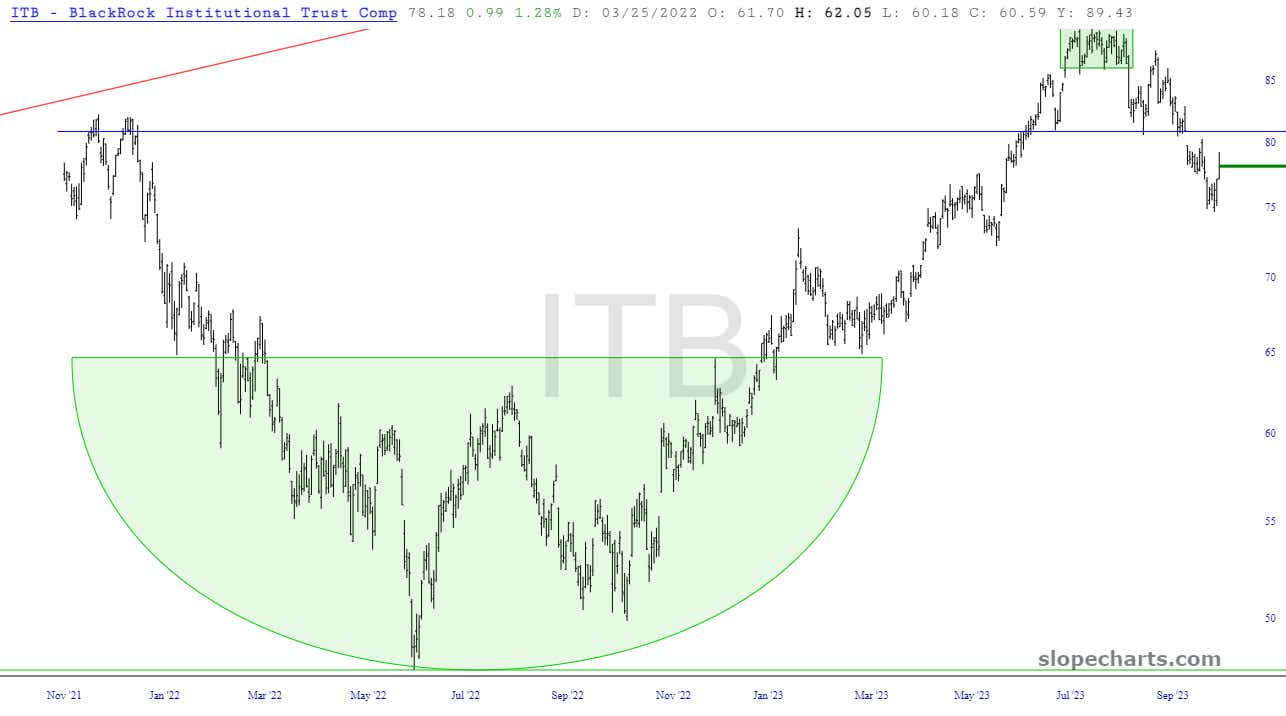
Homebuilders, represented by the iShares U.S. Home Construction ETF (ITB) broke below a long-standing horizontal line. I think there's plenty more to go on the downside here.
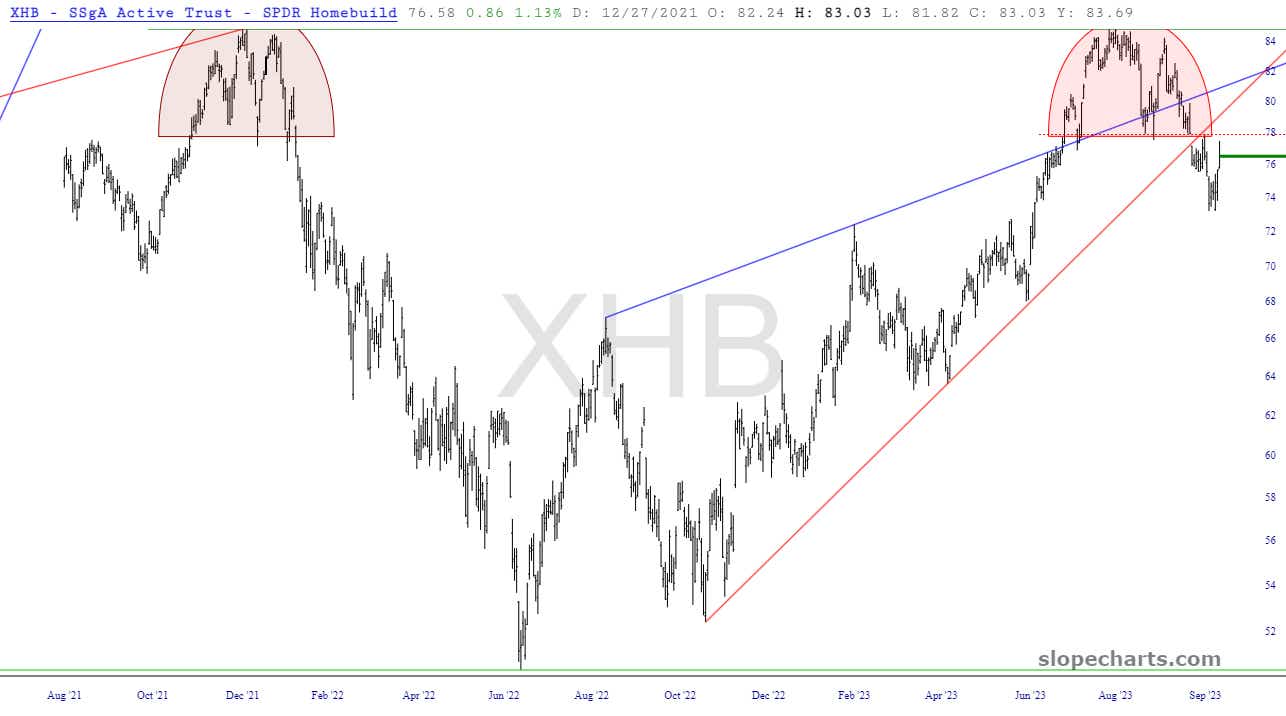
Homebuilders in the SPDR S&P Homebuilders ETF (XHB) have broken a huge wedge pattern, and the pink zone represents a price level that will be difficult for the fund to re-enter.
Small-cap stocks, banks and mid-cap stocks
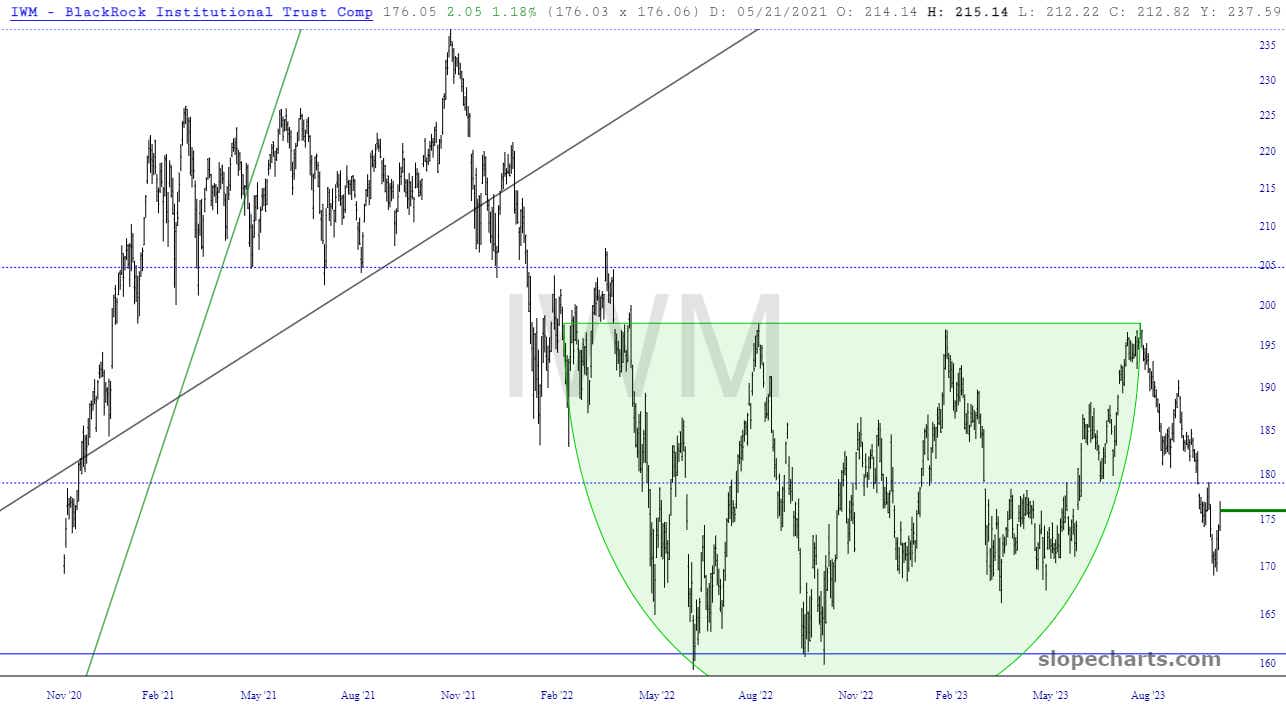
The small caps have been meandering along a tremendous and long-standing sine-wave pattern for the past couple of years. It has become very oversold a week ago, but this extreme has been eliminated, and the blue horizontal line represents a median for this sinewave as well as, conveniently, the neckline of another head-and-shoulders top.
Here is a chart showing the performance of the iShares Russell 2000 ETF (IWM).
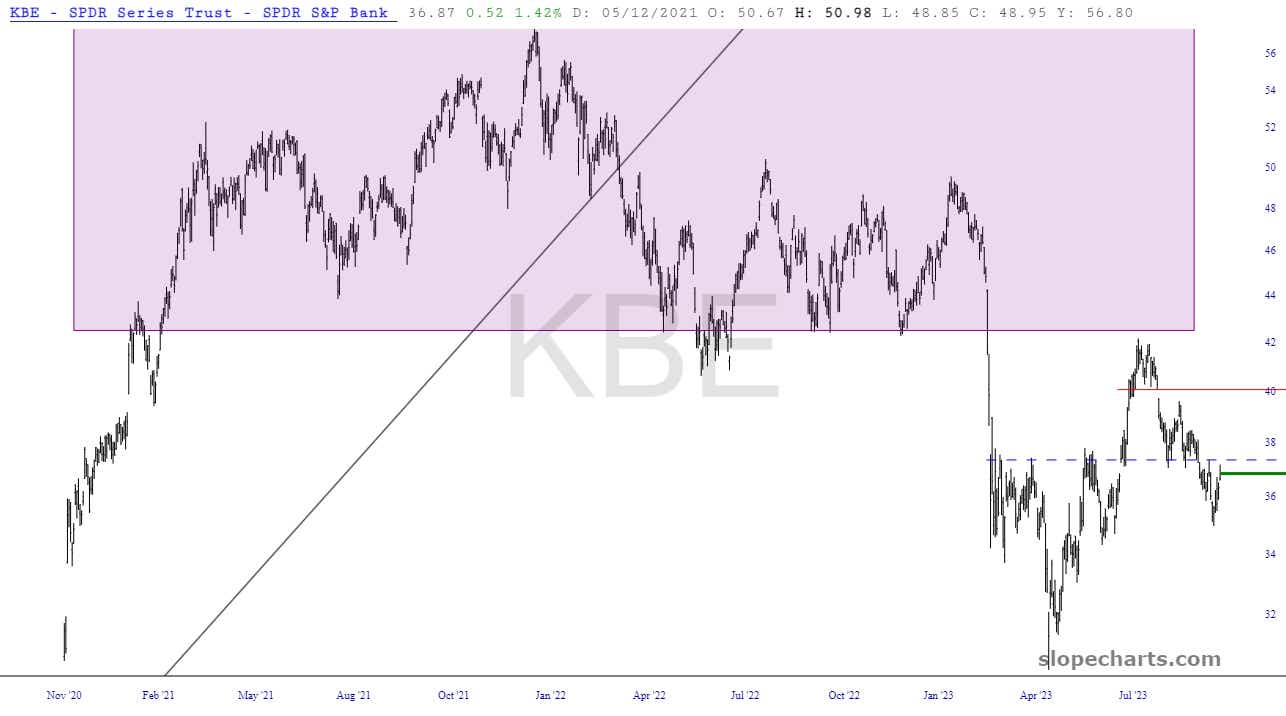
Banks, which are closely aligned with small caps, likewise have bounced mightily, yet the dashed blue line will be a formidable foe for any further price accent. Here's a chart of showing performance of the SPDR S&P Bank ETF (KBE).
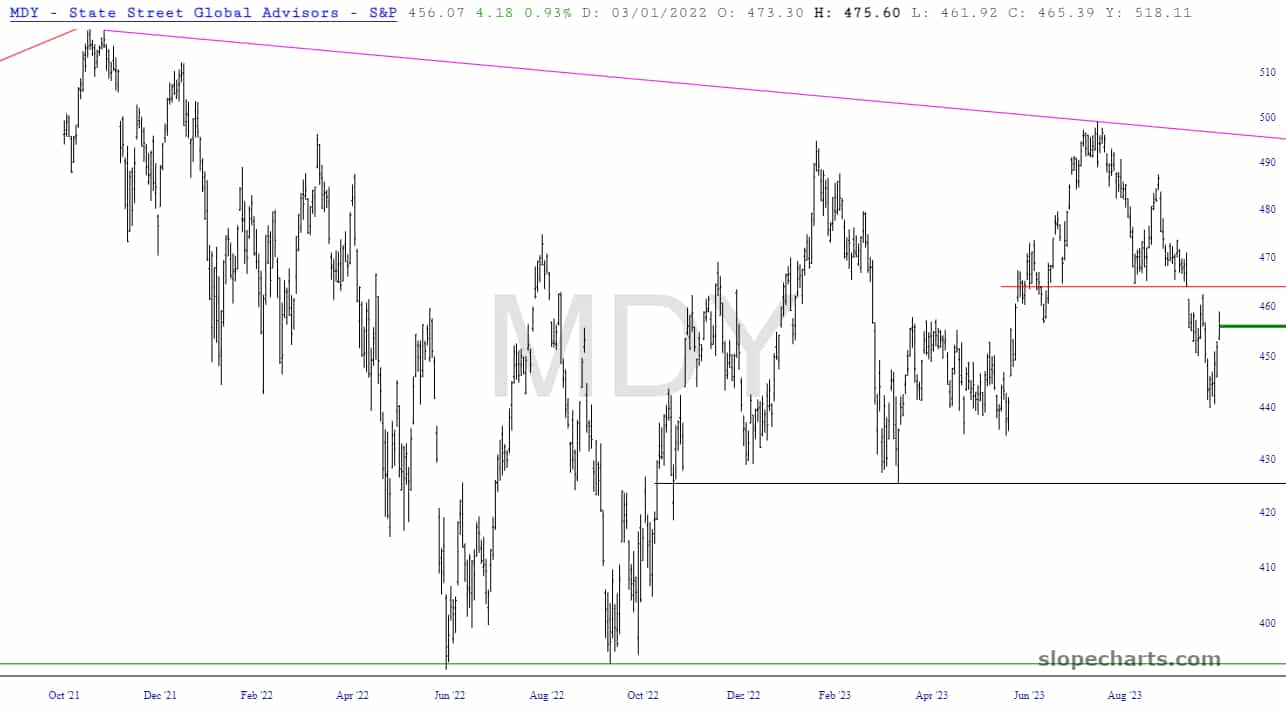
The price gap for the mid-cap markets is the key resistance point for the SPDR S&P MIDCAP 400 ETF Trust (MDY).
Corporate and municipal bonds
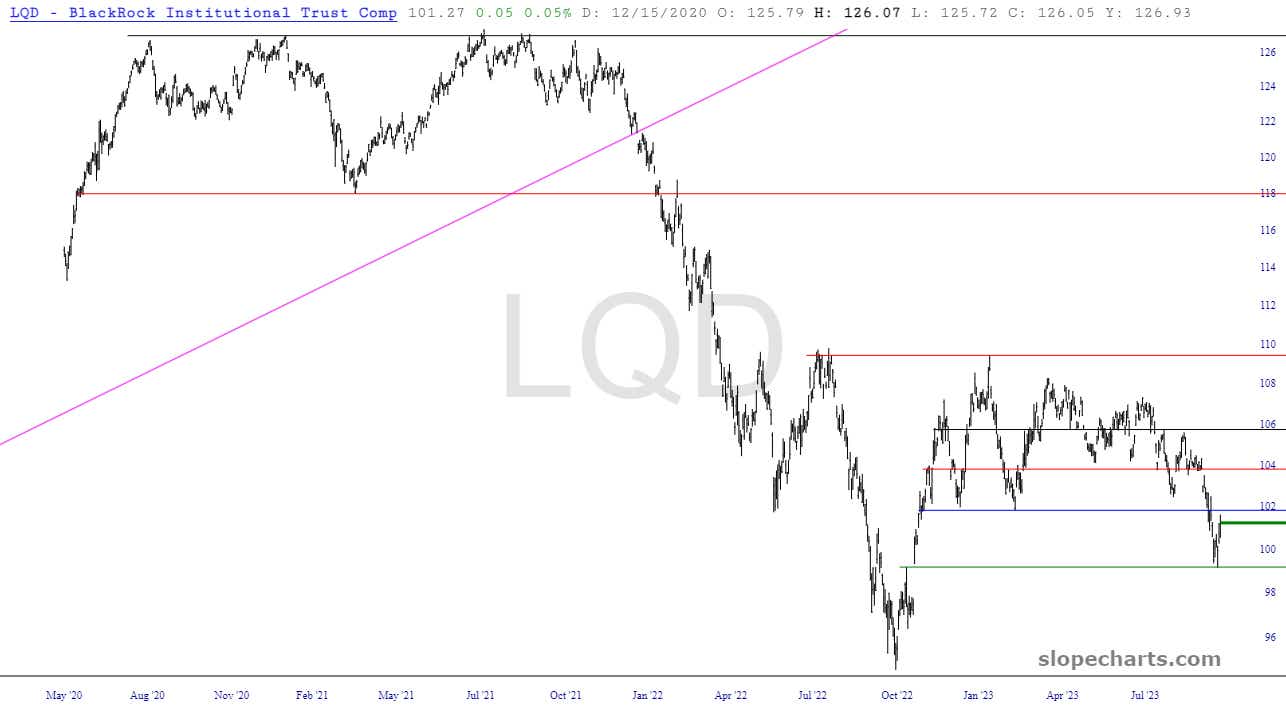
Corporate bonds, as with all other interest-sensitive funds, have rallied recently, causing some relief to interest-rate markets. Below is a chart showing the performance of the iShares iBoxx $ Investment Grade Corporate Bond ETF (LQD). The blue line, only a little above Tuesday's high price, will be a crucial test.
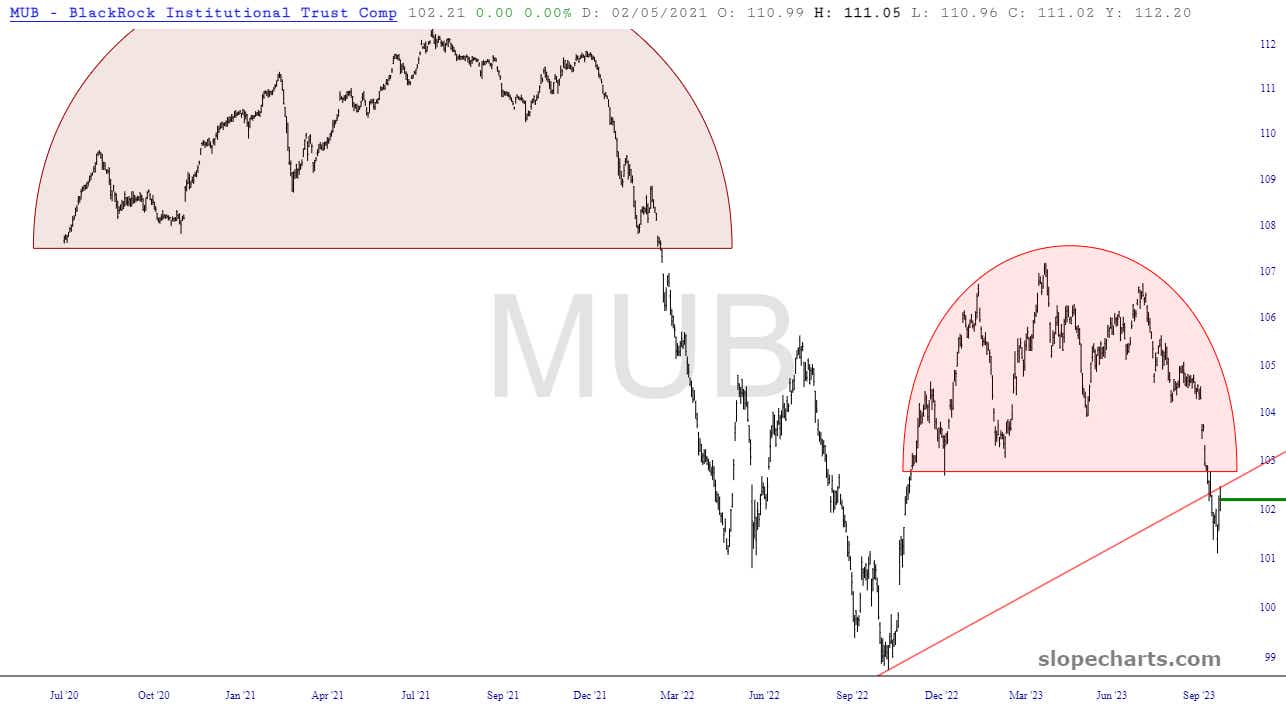
Municipal bonds, which collapsed beneath a lifelong-long trendline (in red) is just beneath that line, which has transformed its role from support to that of resistance. Below, see a chart showing the performance of the represented by the iShares National Muni Bond ETF (MUB).
Large-cap stocks
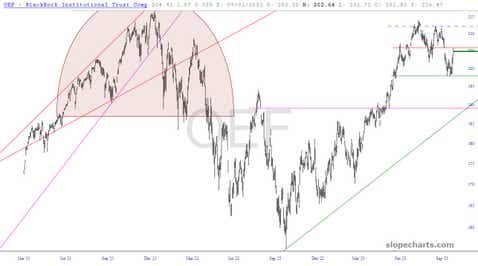
Here we see the iShares S&P 100 ETF (OEF) and its price gap has already been perfectly closed.
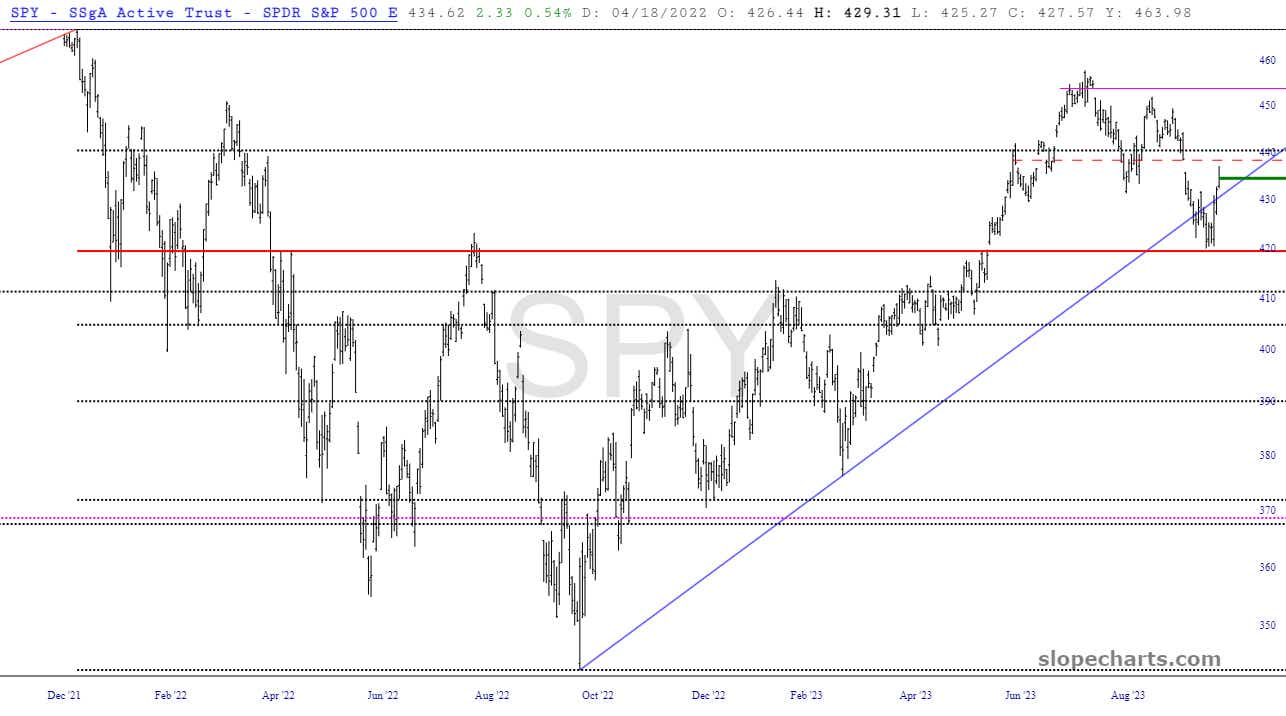
As with the iShares S&P 100 ETF (OEF), its bigger brother SPDR S&P 500 ETF Trust (SPY) has a nearby price gap that was established several weeks ago and will be a vitally important test. If SPY manages to push above this level, the next test is only slightly higher, which represents a major Fibonacci retracement level.
Oil and other industrials
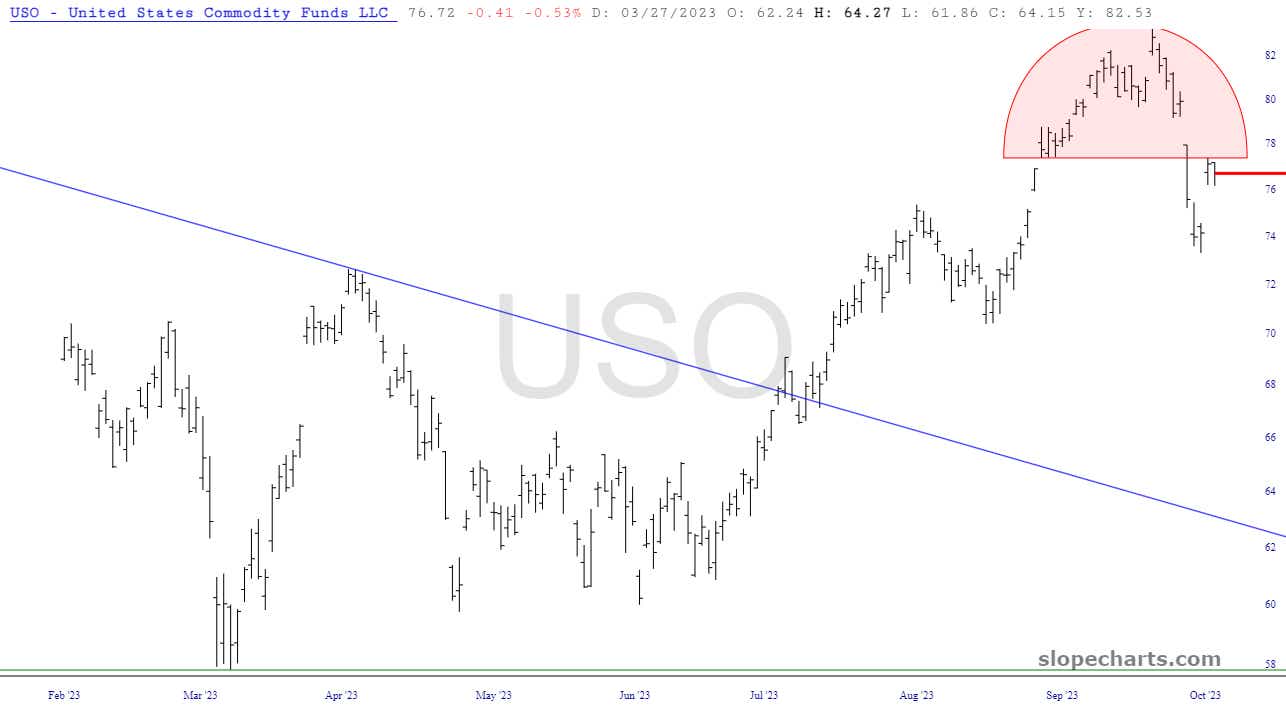
Here is oil, which as mentioned above with DBC, United States Oil Fund LP (USO) has formed a small, rounded top and has bounced just beneath it, thanks to the conflict in the Middle East.
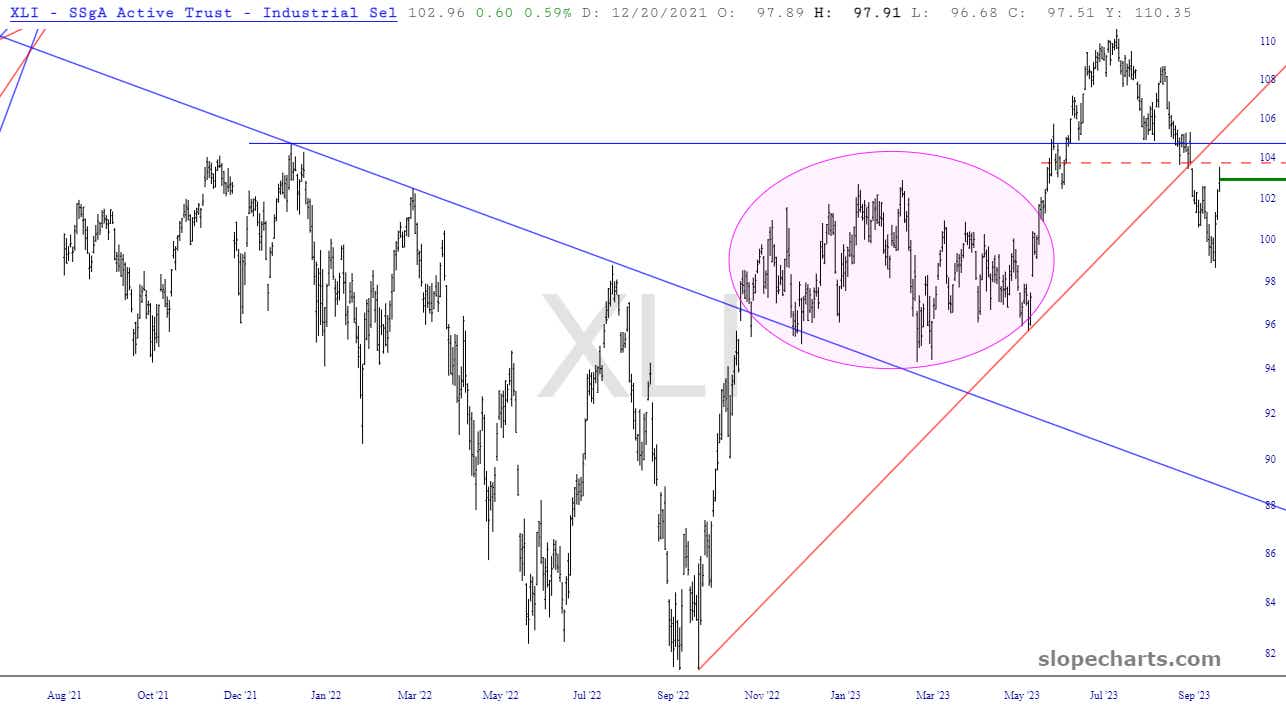
Another flavor of industrials, the Industrial Select Sector SPDR Fund (XLI), is beneath a broken ascending trendline as well as a zone of tremendous overhead supply represented by the dashed line.
Consumer, retail and utility stocks
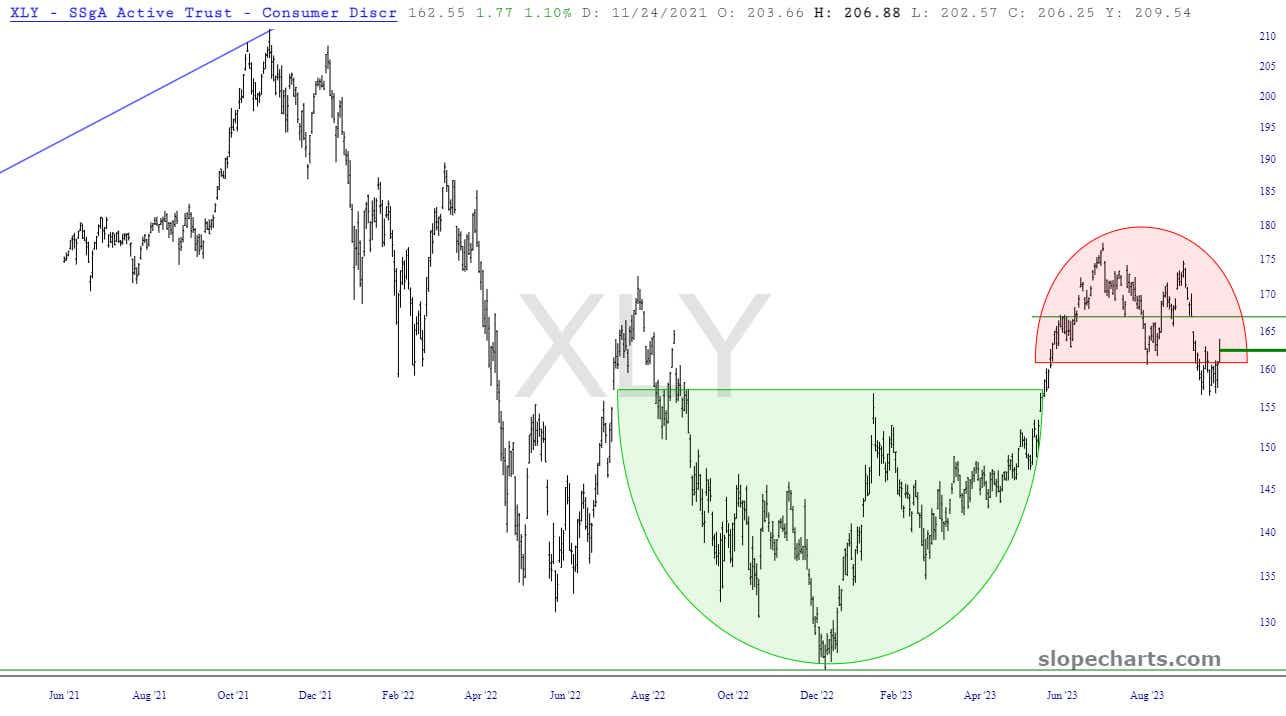
Consumer discretionary, represented here by the Consumer Discretionary Select Sector SPDR Fund (XLY), had benefited from a well-formed bullish base (in green) but is not equally vulnerable to an opposing topping pattern (in pink).
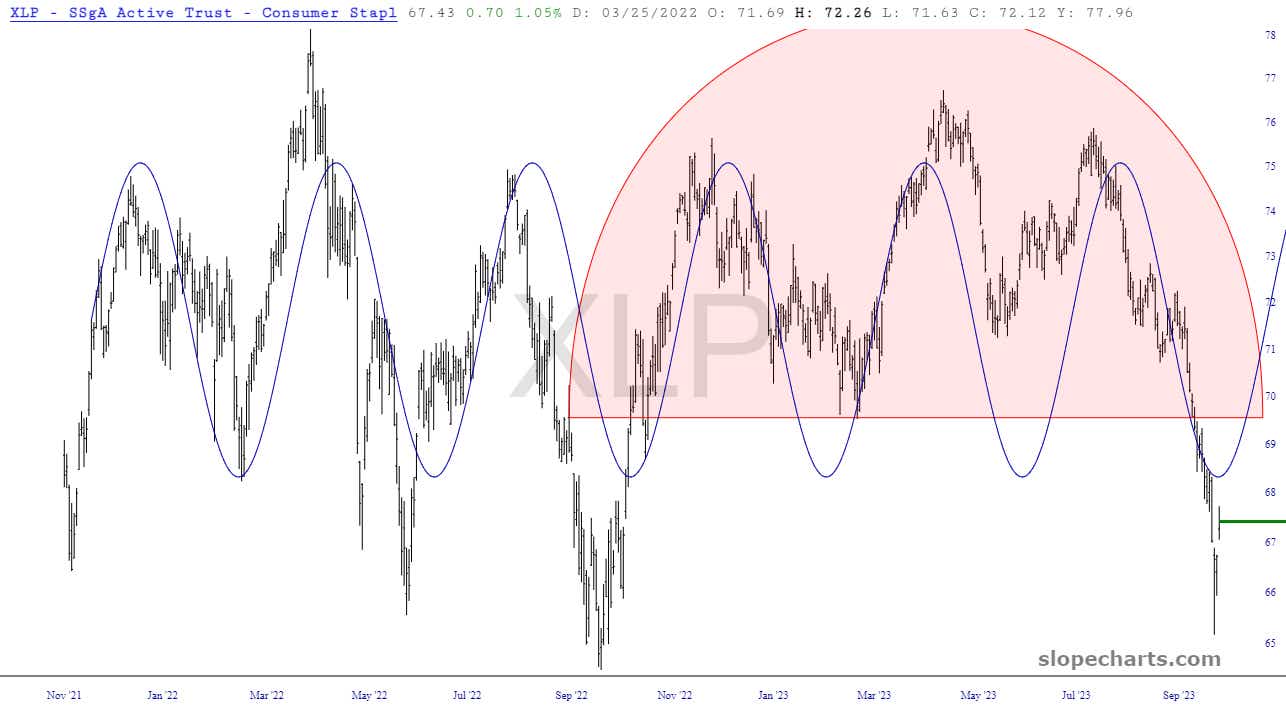
On a different note, below are a couple of extraordinary sine-wave patterns which have been amazing in their temporal regularity. The Consumer Staples Select Sector SPDR Fund (XLP) may have achieved an important bottom on Friday.
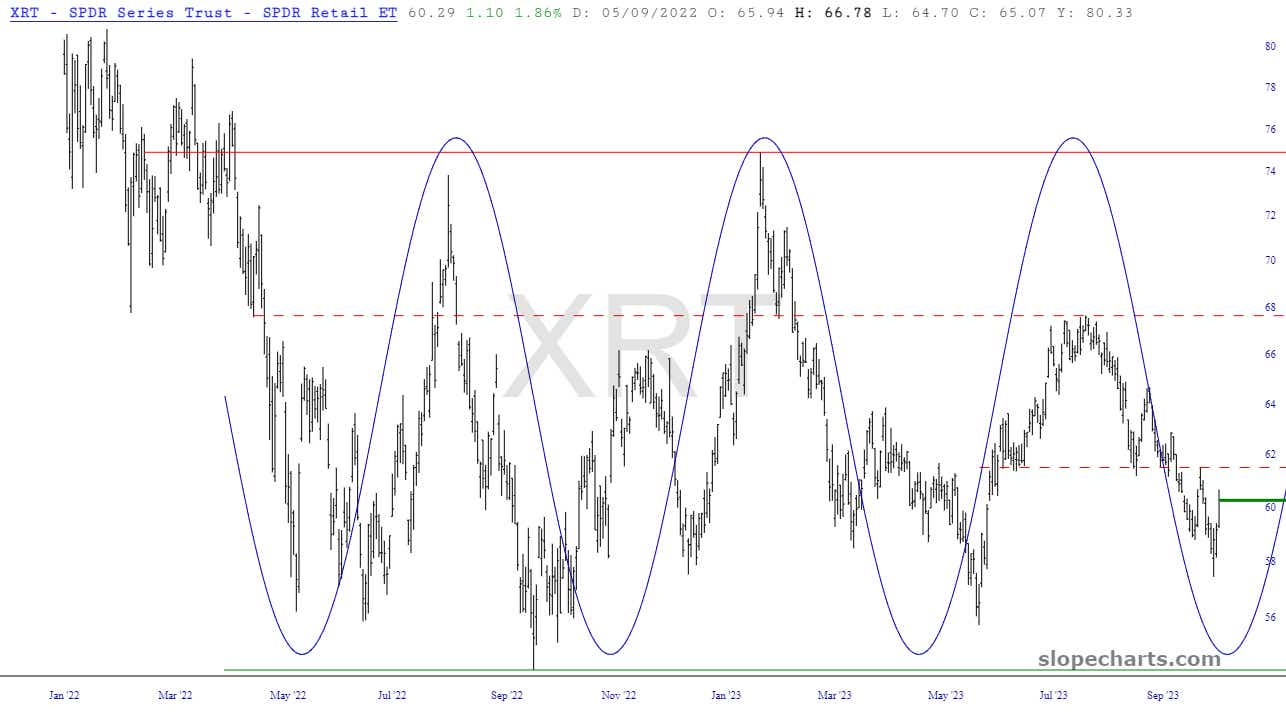
Similarly, retail may have bottomed out, although it is far from a sure thing, considering the state of the rest of the equity market. Below is a chart showing performance of the SPDR S&P Retail ETF (XRT).
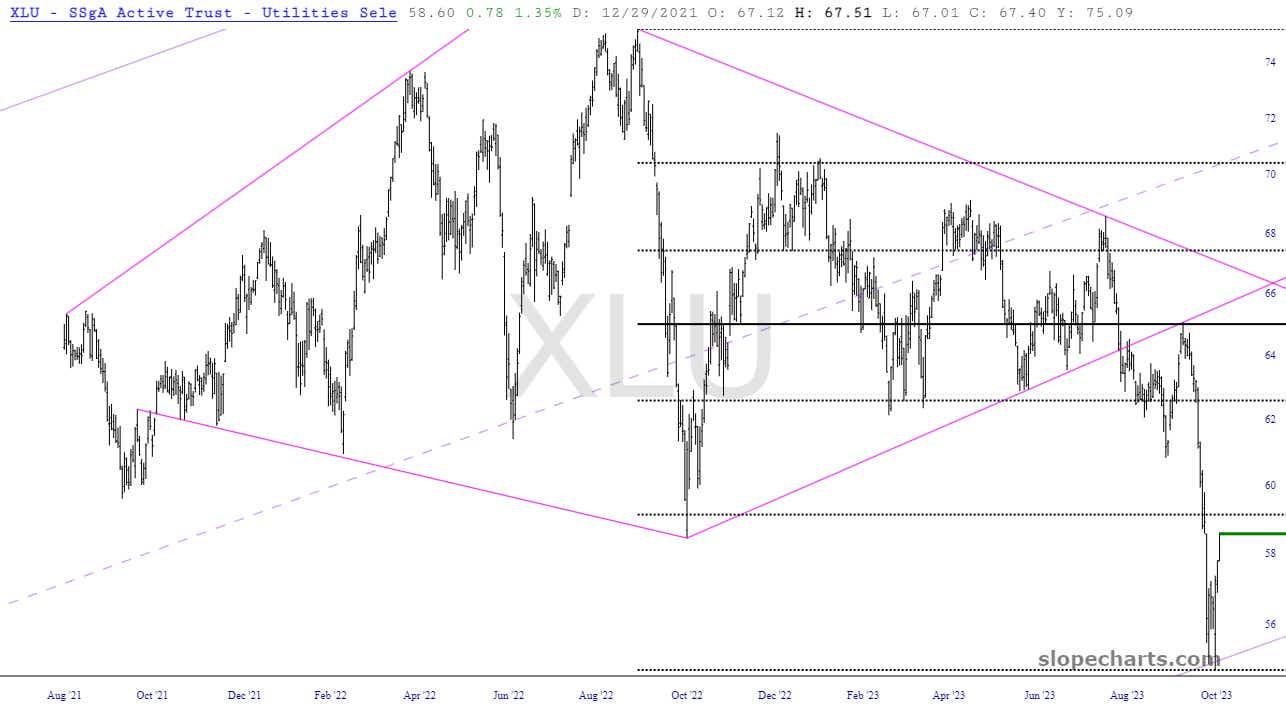
Lastly, the Utilities Select Sector SPDR Fund (XLU) fund has performed sensationally as both a bearish and a bullish trading vehicle. Most recently, it has ascended powerfully toward the Fibonacci line shown below and is very close to achieving the target I set in place when it bounced off its lifelong bullish trendline last week.
Tim Knight, a charting analyst with 35 years of trading experience, hosts Trading Charts, a tastylive segment airing Monday-Friday. He founded slopeofhope.com in 2005 and uses it as the basis of his technical charting and analysis. Knight authors The Technician column for Luckbox magazine.
For live daily programming, market news and commentary, visit tastylive or the YouTube channels tastylive (for options traders), and tastyliveTrending for stocks, futures, forex & macro.
Trade with a better broker, open a tastytrade account today. tastylive, Inc. and tastytrade, Inc. are separate but affiliated companies.
Options involve risk and are not suitable for all investors. Please read Characteristics and Risks of Standardized Options before deciding to invest in options.
tastylive content is created, produced, and provided solely by tastylive, Inc. (“tastylive”) and is for informational and educational purposes only. It is not, nor is it intended to be, trading or investment advice or a recommendation that any security, futures contract, digital asset, other product, transaction, or investment strategy is suitable for any person. Trading securities, futures products, and digital assets involve risk and may result in a loss greater than the original amount invested. tastylive, through its content, financial programming or otherwise, does not provide investment or financial advice or make investment recommendations. Investment information provided may not be appropriate for all investors and is provided without respect to individual investor financial sophistication, financial situation, investing time horizon or risk tolerance. tastylive is not in the business of transacting securities trades, nor does it direct client commodity accounts or give commodity trading advice tailored to any particular client’s situation or investment objectives. Supporting documentation for any claims (including claims made on behalf of options programs), comparisons, statistics, or other technical data, if applicable, will be supplied upon request. tastylive is not a licensed financial adviser, registered investment adviser, or a registered broker-dealer. Options, futures, and futures options are not suitable for all investors. Prior to trading securities, options, futures, or futures options, please read the applicable risk disclosures, including, but not limited to, the Characteristics and Risks of Standardized Options Disclosure and the Futures and Exchange-Traded Options Risk Disclosure found on tastytrade.com/disclosures.
tastytrade, Inc. ("tastytrade”) is a registered broker-dealer and member of FINRA, NFA, and SIPC. tastytrade was previously known as tastyworks, Inc. (“tastyworks”). tastytrade offers self-directed brokerage accounts to its customers. tastytrade does not give financial or trading advice, nor does it make investment recommendations. You alone are responsible for making your investment and trading decisions and for evaluating the merits and risks associated with the use of tastytrade’s systems, services or products. tastytrade is a wholly-owned subsidiary of tastylive, Inc.
tastytrade has entered into a Marketing Agreement with tastylive (“Marketing Agent”) whereby tastytrade pays compensation to Marketing Agent to recommend tastytrade’s brokerage services. The existence of this Marketing Agreement should not be deemed as an endorsement or recommendation of Marketing Agent by tastytrade. tastytrade and Marketing Agent are separate entities with their own products and services. tastylive is the parent company of tastytrade.
tastyfx, LLC (“tastyfx”) is a Commodity Futures Trading Commission (“CFTC”) registered Retail Foreign Exchange Dealer (RFED) and Introducing Broker (IB) and Forex Dealer Member (FDM) of the National Futures Association (“NFA”) (NFA ID 0509630). Leveraged trading in foreign currency or off-exchange products on margin carries significant risk and may not be suitable for all investors. We advise you to carefully consider whether trading is appropriate for you based on your personal circumstances as you may lose more than you invest.
tastycrypto is provided solely by tasty Software Solutions, LLC. tasty Software Solutions, LLC is a separate but affiliate company of tastylive, Inc. Neither tastylive nor any of its affiliates are responsible for the products or services provided by tasty Software Solutions, LLC. Cryptocurrency trading is not suitable for all investors due to the number of risks involved. The value of any cryptocurrency, including digital assets pegged to fiat currency, commodities, or any other asset, may go to zero.
© copyright 2013 - 2026 tastylive, Inc. All Rights Reserved. Applicable portions of the Terms of Use on tastylive.com apply. Reproduction, adaptation, distribution, public display, exhibition for profit, or storage in any electronic storage media in whole or in part is prohibited under penalty of law, provided that you may download tastylive’s podcasts as necessary to view for personal use. tastylive was previously known as tastytrade, Inc. tastylive is a trademark/servicemark owned by tastylive, Inc.
Your privacy choices