Technical Indicators for the S&P 500 and Russell 2000 Flashing Red

Technical Indicators for the S&P 500 and Russell 2000 Flashing Red
Seasonal indicators are also pointing lower
- The Federal Reserve’s "hawkish hold" has led to nothing good for stocks and bonds.
- /ESZ3 and /NQZ3 remain in multi-month ranges, but are quickly approaching critical support
- /RTYZ3 has started to breakdown through the neckline of a head and shoulders pattern.
There’s an old adage on Wall Street, “sell on Rosh Hashanah, buy on Yom Kippur.”
There’s a statistical basis for this claim: over the past 50 years, the S&P 500 has declined by 0.50% during this holiday window. It also comports with the broader seasonal tendency for equities to decline in September, which has been the worst month of the year for stocks across multiple time periods (5-, 10-, 15-, 20-, 50-years – dealer’s choice).
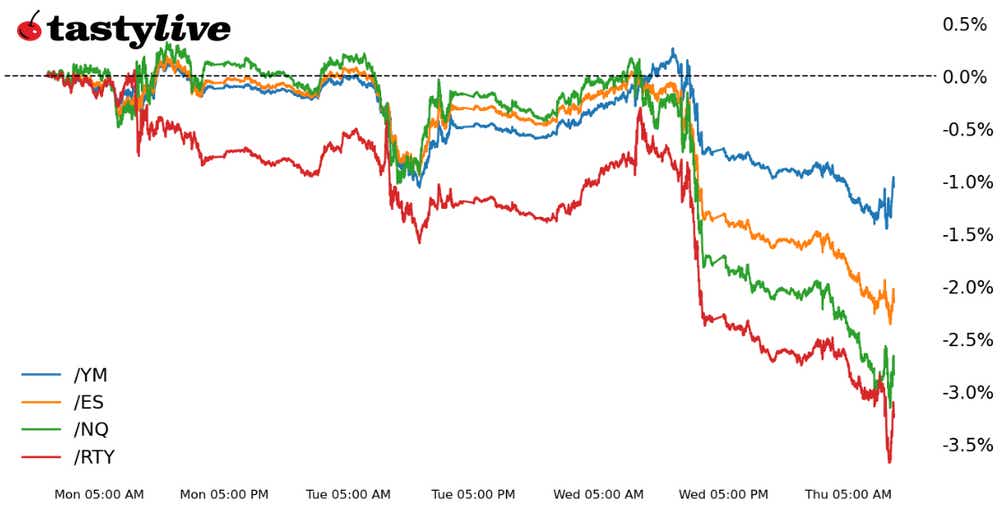
This year is proving to be no exception to the rule. The Federal Reserve’s rate decision yesterday jumpstarted a sell-off across the four major U.S. equity futures markets, with the Nasdaq 100 (/NQZ3) and the Russell 2000 (/RTYZ3) leading the way lower. High(er) for longer, as evidenced by the Federal Open Market Committee's (FOMC) belief that two fewer rate cuts will be delivered in 2024, has spooked traders, plain and simple. The technical damage is stacking up, and now stocks are sitting on the precipice of a more significant breakdown in price action.
/ES S&P 500 price technical analysis: daily chart (September 2022 to September 2023)
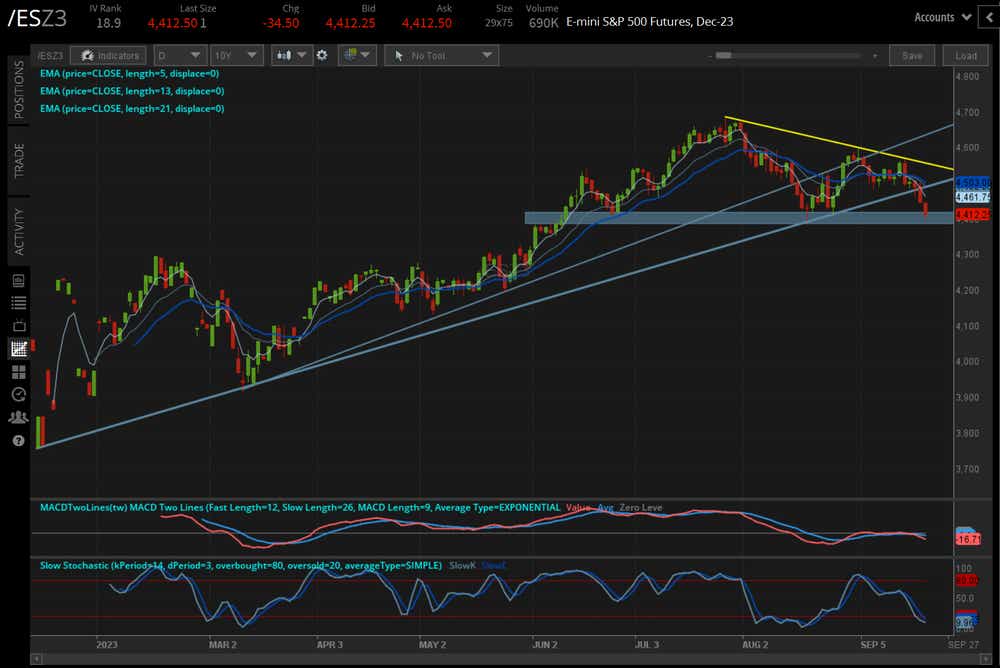
/ESZ3 has broken down out of a triangle that has formed from the March and August swing lows and the July and August swing highs. Momentum is increasingly bearish. /ESZ3’s daily 5-, 13-, and 21-day exponential moving average (EMA) envelope is now in bearish sequential order. The moving average convergence/divergence (MACD) is trending lower below its signal line, and slow stochastics are back in oversold territory. Below the August swing low of 4397.75 a potential head and shoulders topping pattern comes into focus, with a measured move of -287.50 points pointing to 4110.25.
/NQ Nasdaq 100 price technical analysis: daily chart (December 2022 to September 2023)
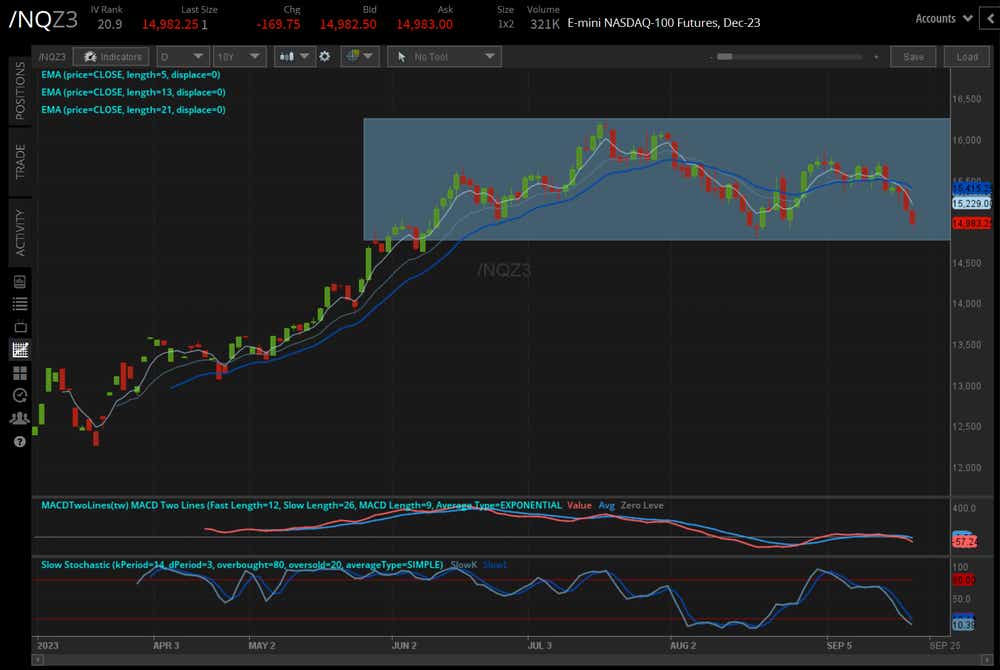
/NQZ3 has fallen back in recent days, but still remains nestled in its multi-month range. Momentum is turning more bearish, however. MACD is trending lower below its signal line, and slow stochastics have returned to oversold territory. /NQZ3 is also below its daily EMA envelope, and the EMA envelope is in bearish sequential order. Range support comes nearby at the August swing low at 14792.75.
/RTY Russell 2000 price technical analysis: daily chart (April 2023 to September 2023)
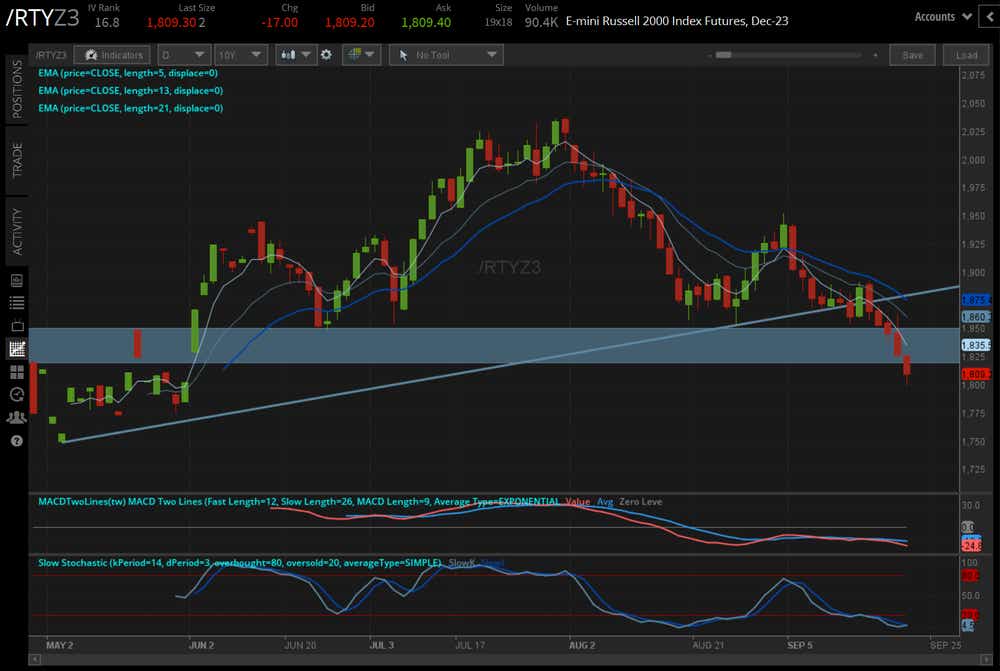
Among the three U.S. equity futures covered in this note, the technical outlook for /RTYZ3 is easily the most disconcerting. Having broken below the critical 1820/50 area –which has been both support and resistance since the onset of the regional banking crisis in March–it now appears that a head-and-shoulders topping pattern is in play. Momentum is bearish, through and through (MACD, slow stochastics, and the EMA profile). With regional banks leading lower amid a push higher in U.S. Treasury yields, a return to /RTYZ3’s yearly low at 1750 is in the cards—and a deeper setback is looking increasingly possible.
Christopher Vecchio, CFA, tastylive’s head of futures and forex, has been trading for nearly 20 years. He has consulted with multinational firms on FX hedging and lectured at Duke Law School on FX derivatives. Vecchio searches for high-convexity opportunities at the crossroads of macroeconomics and global politics. He hosts Futures Power Hour Monday-Friday and Let Me Explain on Tuesdays, and co-hosts Overtime, Monday-Thursday. @cvecchiofx
For live daily programming, market news and commentary, visit tastylive or the YouTube channels tastylive (for options traders), and tastyliveTrending for stocks, futures, forex & macro.
Trade with a better broker, open a tastytrade account today. tastylive, Inc. and tastytrade, Inc. are separate but affiliated companies.
Options involve risk and are not suitable for all investors. Please read Characteristics and Risks of Standardized Options before deciding to invest in options.
tastylive content is created, produced, and provided solely by tastylive, Inc. (“tastylive”) and is for informational and educational purposes only. It is not, nor is it intended to be, trading or investment advice or a recommendation that any security, futures contract, digital asset, other product, transaction, or investment strategy is suitable for any person. Trading securities, futures products, and digital assets involve risk and may result in a loss greater than the original amount invested. tastylive, through its content, financial programming or otherwise, does not provide investment or financial advice or make investment recommendations. Investment information provided may not be appropriate for all investors and is provided without respect to individual investor financial sophistication, financial situation, investing time horizon or risk tolerance. tastylive is not in the business of transacting securities trades, nor does it direct client commodity accounts or give commodity trading advice tailored to any particular client’s situation or investment objectives. Supporting documentation for any claims (including claims made on behalf of options programs), comparisons, statistics, or other technical data, if applicable, will be supplied upon request. tastylive is not a licensed financial adviser, registered investment adviser, or a registered broker-dealer. Options, futures, and futures options are not suitable for all investors. Prior to trading securities, options, futures, or futures options, please read the applicable risk disclosures, including, but not limited to, the Characteristics and Risks of Standardized Options Disclosure and the Futures and Exchange-Traded Options Risk Disclosure found on tastytrade.com/disclosures.
tastytrade, Inc. ("tastytrade”) is a registered broker-dealer and member of FINRA, NFA, and SIPC. tastytrade was previously known as tastyworks, Inc. (“tastyworks”). tastytrade offers self-directed brokerage accounts to its customers. tastytrade does not give financial or trading advice, nor does it make investment recommendations. You alone are responsible for making your investment and trading decisions and for evaluating the merits and risks associated with the use of tastytrade’s systems, services or products. tastytrade is a wholly-owned subsidiary of tastylive, Inc.
tastytrade has entered into a Marketing Agreement with tastylive (“Marketing Agent”) whereby tastytrade pays compensation to Marketing Agent to recommend tastytrade’s brokerage services. The existence of this Marketing Agreement should not be deemed as an endorsement or recommendation of Marketing Agent by tastytrade. tastytrade and Marketing Agent are separate entities with their own products and services. tastylive is the parent company of tastytrade.
tastyfx, LLC (“tastyfx”) is a Commodity Futures Trading Commission (“CFTC”) registered Retail Foreign Exchange Dealer (RFED) and Introducing Broker (IB) and Forex Dealer Member (FDM) of the National Futures Association (“NFA”) (NFA ID 0509630). Leveraged trading in foreign currency or off-exchange products on margin carries significant risk and may not be suitable for all investors. We advise you to carefully consider whether trading is appropriate for you based on your personal circumstances as you may lose more than you invest.
tastycrypto is provided solely by tasty Software Solutions, LLC. tasty Software Solutions, LLC is a separate but affiliate company of tastylive, Inc. Neither tastylive nor any of its affiliates are responsible for the products or services provided by tasty Software Solutions, LLC. Cryptocurrency trading is not suitable for all investors due to the number of risks involved. The value of any cryptocurrency, including digital assets pegged to fiat currency, commodities, or any other asset, may go to zero.
© copyright 2013 - 2026 tastylive, Inc. All Rights Reserved. Applicable portions of the Terms of Use on tastylive.com apply. Reproduction, adaptation, distribution, public display, exhibition for profit, or storage in any electronic storage media in whole or in part is prohibited under penalty of law, provided that you may download tastylive’s podcasts as necessary to view for personal use. tastylive was previously known as tastytrade, Inc. tastylive is a trademark/servicemark owned by tastylive, Inc.
Your privacy choices