Nasdaq 100 Enters Correction Territory

Nasdaq 100 Enters Correction Territory
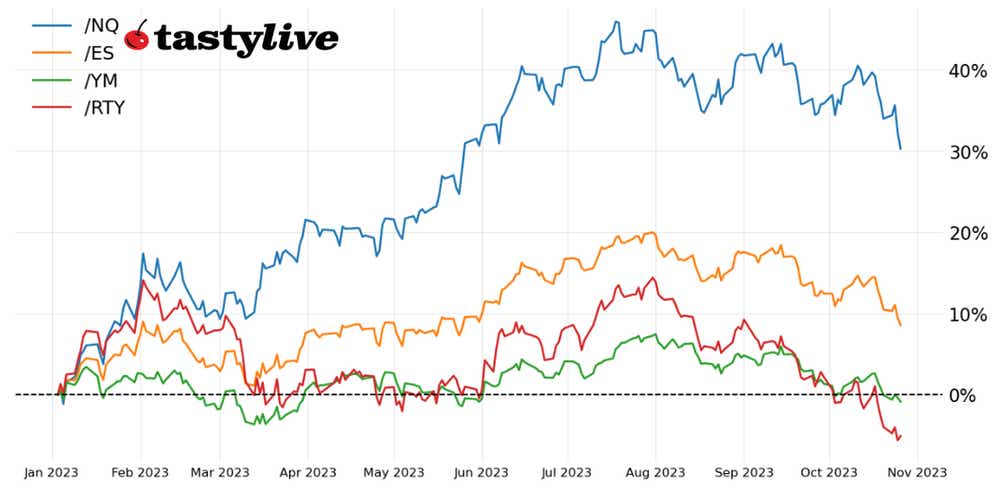
Also, the S&P 500 down 3.54% month-to-date
- The Nasdaq 100 (/NQZ3) is now down more than 10% from its yearly high, which means it has officially entered technical correction territory.
- The S&P 500 (/ESZ3) is near correction territory, but a head-and-shoulders pattern suggests a drop to 4110.25 could be in the making.
- Breadth is very weak: 46% of stocks in the Nasdaq 100 are above their 200-day simple moving averages (SMA), the lowest level since Jan. 6. Only 27% of stocks in the S&P 500 are above their 200-day SMAs, the lowest level since Oct. 25, 2022.
The best laid plans of mice and men often go awry. Particularly if those men are stock market bulls in October, which has typically been a strong month that often brings about the end to bear markets.
Alas, geopolitical event risk has swelled as the Israel-Hamas war has raged on, kneecapping optimism. And earnings have proved increasingly disappointing as the season has gone on, with the blended earnings growth rate now down 0.4% on the quarter. Moreover, U.S. Treasury yields have surged, bringing the 10-year yield above the S&P 500’s earning’s yield, a crucial event that shifts risk preferences away from stocks.
Nothing good in the short term for stocks
Fundamentally, the situation has soured rapidly in the span of a few weeks, undercutting the previous bullish technical setups in play earlier this month. Now, a review of the charts shows nothing good in the short term for the S&P 500 (/ESZ3), the Nasdaq 100 (/NQZ3), and the Russell 2000 (/RTYZ3).
/ES S&P 500 price technical analysis: daily chart (October 2022 to October 2023)
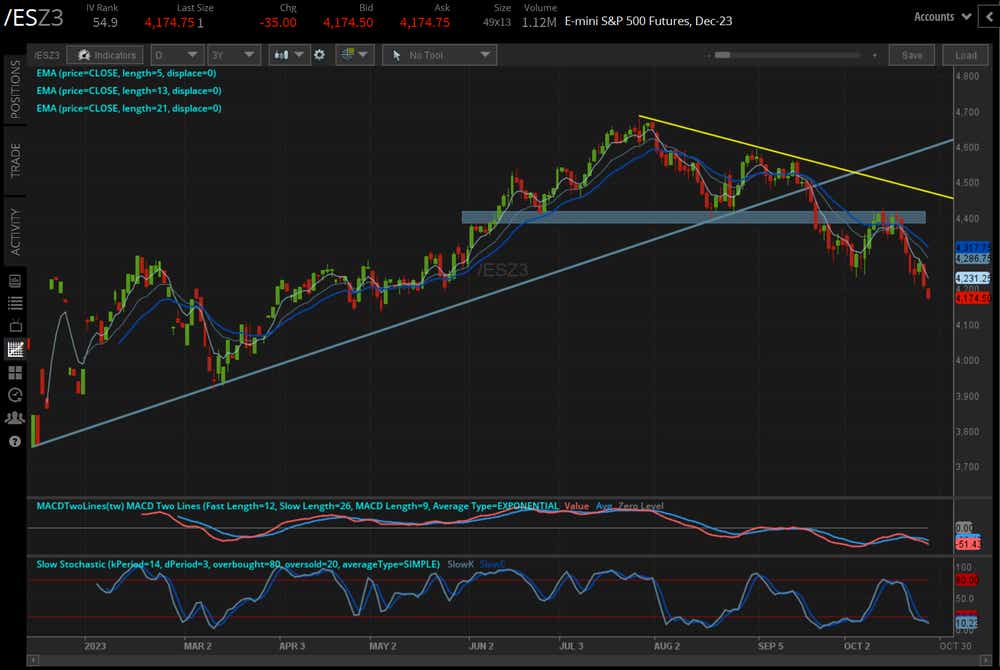
While /ESZ3 reclaimed the neckline of a head and shoulder’s pattern, that rebound did not last. Instead, rejection developed, setting up a more significant topping effort; new monthly lows have been reached.
Momentum is firmly bearish, with /ESZ3 below its daily 5-, 13-, and 21-dsy exponential moving average (EMA) envelope, which is in bearish sequential order. moving average convergence/divergence (MACD) is trending lower while below its signal line, and slow stochastics, a momentum indicator, are back in oversold territory. So much for a meaningful low being established. The measured move in the head and shoulders pattern extends to 4110.25.
/NQ Nasdaq 100 price technical analysis: daily chart (December 2022 to October 2023)
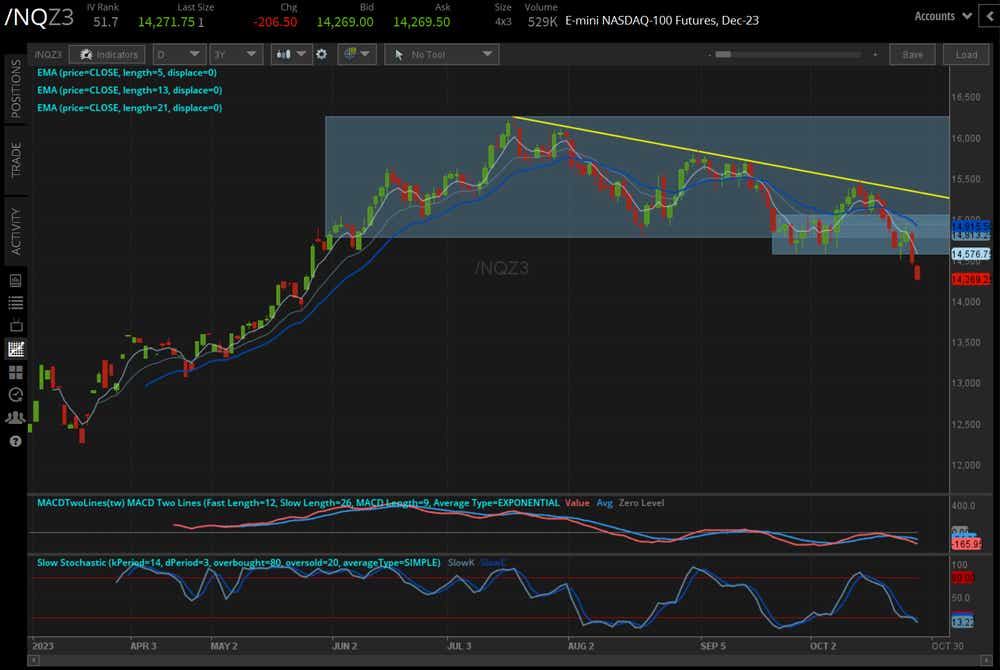
In the mid-October update, we observed that “15100 was breached, sending /NQZ3 racing to the topside in recent sessions. Resistance arrives soon, however: the trendline off the July, August, and September swing highs comes into focus near 15450/500 over the coming sessions.” The trendline produced resistance that marked the highs for the month; it’s been downhill ever since then.
Not only did /NQZ3 return to the double-bottom consolidation, but it has also quickly breached the monthly lows, falling to the lowest levels since late-May. Like /ESZ3, /NQZ3 has a bearish momentum profile that is fully aligned across the board. That includes EMA envelopes, MACD and slow stochastics. Even though measures of volatility are elevated (IV index: 26.3%; IVR: 51.8), it’s too soon to try and look to sell puts to call the lows if momentum is decidedly bearish in the short term.
/RTY Russell 2000 price technical analysis: daily chart (April 2023 to October 2023)
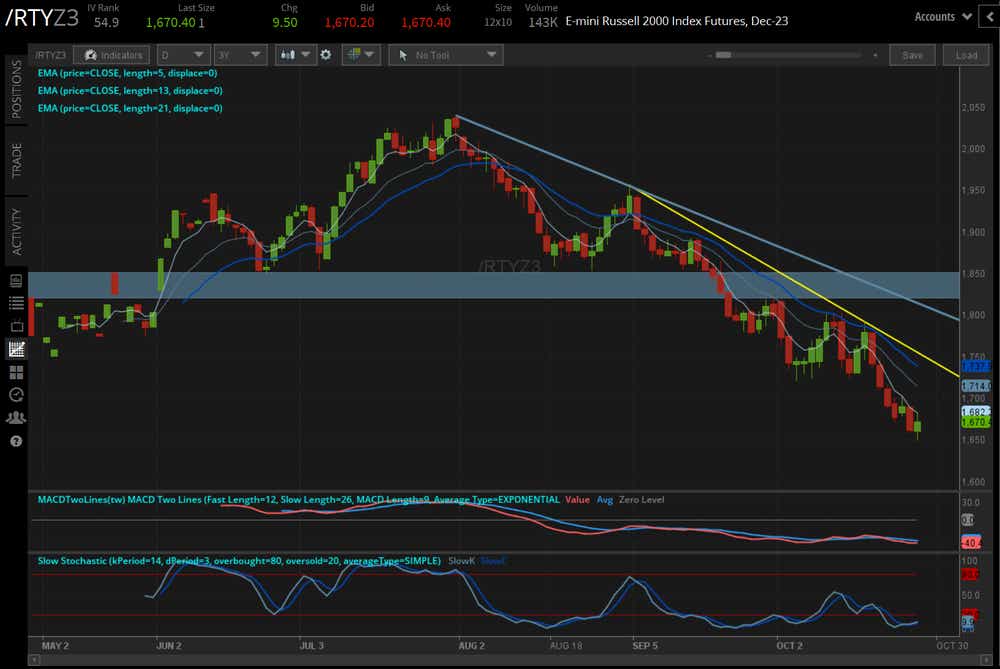
/RTYZ3 never was able to reclaim the 1820/50 threshold, and in turn the downtrend in place from the August and September swing highs remains in place.
Moreover, during the rebound, /RTYZ3 was unable to close above its daily 21-day EMA (one-month moving average), an indication that the thrust lower hasn’t been completed (conversely, a close above the daily 21-day EMA would be an important signal that a bottom may have been reached; not yet though).
In breaching the spring lows that defined the depths of the regional banking crisis, /RTYZ3 has the ugliest technical structure among the major U.S. stock index futures.
Christopher Vecchio, CFA, tastylive’s head of futures and forex, has been trading for nearly 20 years. He has consulted with multinational firms on FX hedging and lectured at Duke Law School on FX derivatives. Vecchio searches for high-convexity opportunities at the crossroads of macroeconomics and global politics. He hosts Futures Power Hour Monday-Friday and Let Me Explain on Tuesdays, and co-hosts Overtime, Monday-Thursday. @cvecchiofx
For live daily programming, market news and commentary, visit tastylive or the YouTube channels tastylive (for options traders), and tastyliveTrending for stocks, futures, forex & macro.
Trade with a better broker, open a tastytrade account today. tastylive, Inc. and tastytrade, Inc. are separate but affiliated companies.
Options involve risk and are not suitable for all investors. Please read Characteristics and Risks of Standardized Options before deciding to invest in options.
tastylive content is created, produced, and provided solely by tastylive, Inc. (“tastylive”) and is for informational and educational purposes only. It is not, nor is it intended to be, trading or investment advice or a recommendation that any security, futures contract, digital asset, other product, transaction, or investment strategy is suitable for any person. Trading securities, futures products, and digital assets involve risk and may result in a loss greater than the original amount invested. tastylive, through its content, financial programming or otherwise, does not provide investment or financial advice or make investment recommendations. Investment information provided may not be appropriate for all investors and is provided without respect to individual investor financial sophistication, financial situation, investing time horizon or risk tolerance. tastylive is not in the business of transacting securities trades, nor does it direct client commodity accounts or give commodity trading advice tailored to any particular client’s situation or investment objectives. Supporting documentation for any claims (including claims made on behalf of options programs), comparisons, statistics, or other technical data, if applicable, will be supplied upon request. tastylive is not a licensed financial adviser, registered investment adviser, or a registered broker-dealer. Options, futures, and futures options are not suitable for all investors. Prior to trading securities, options, futures, or futures options, please read the applicable risk disclosures, including, but not limited to, the Characteristics and Risks of Standardized Options Disclosure and the Futures and Exchange-Traded Options Risk Disclosure found on tastytrade.com/disclosures.
tastytrade, Inc. ("tastytrade”) is a registered broker-dealer and member of FINRA, NFA, and SIPC. tastytrade was previously known as tastyworks, Inc. (“tastyworks”). tastytrade offers self-directed brokerage accounts to its customers. tastytrade does not give financial or trading advice, nor does it make investment recommendations. You alone are responsible for making your investment and trading decisions and for evaluating the merits and risks associated with the use of tastytrade’s systems, services or products. tastytrade is a wholly-owned subsidiary of tastylive, Inc.
tastytrade has entered into a Marketing Agreement with tastylive (“Marketing Agent”) whereby tastytrade pays compensation to Marketing Agent to recommend tastytrade’s brokerage services. The existence of this Marketing Agreement should not be deemed as an endorsement or recommendation of Marketing Agent by tastytrade. tastytrade and Marketing Agent are separate entities with their own products and services. tastylive is the parent company of tastytrade.
tastyfx, LLC (“tastyfx”) is a Commodity Futures Trading Commission (“CFTC”) registered Retail Foreign Exchange Dealer (RFED) and Introducing Broker (IB) and Forex Dealer Member (FDM) of the National Futures Association (“NFA”) (NFA ID 0509630). Leveraged trading in foreign currency or off-exchange products on margin carries significant risk and may not be suitable for all investors. We advise you to carefully consider whether trading is appropriate for you based on your personal circumstances as you may lose more than you invest.
tastycrypto is provided solely by tasty Software Solutions, LLC. tasty Software Solutions, LLC is a separate but affiliate company of tastylive, Inc. Neither tastylive nor any of its affiliates are responsible for the products or services provided by tasty Software Solutions, LLC. Cryptocurrency trading is not suitable for all investors due to the number of risks involved. The value of any cryptocurrency, including digital assets pegged to fiat currency, commodities, or any other asset, may go to zero.
© copyright 2013 - 2026 tastylive, Inc. All Rights Reserved. Applicable portions of the Terms of Use on tastylive.com apply. Reproduction, adaptation, distribution, public display, exhibition for profit, or storage in any electronic storage media in whole or in part is prohibited under penalty of law, provided that you may download tastylive’s podcasts as necessary to view for personal use. tastylive was previously known as tastytrade, Inc. tastylive is a trademark/servicemark owned by tastylive, Inc.
Your privacy choices