Nasdaq 100, Russell 2000 Break Bearish Momentum

Nasdaq 100, Russell 2000 Break Bearish Momentum
Nasdaq 100 down 4.90% month-to-date
- Having survived both NVDA earnings and the Federal Reserve’s Jackson Hole conference, stocks are continuing to claw higher.
- Both /ESU3 and /NQU3 are carving out ranges.
- /RTYU3 is starting to bounce back above a key trendline that suggests the correction may be finished.
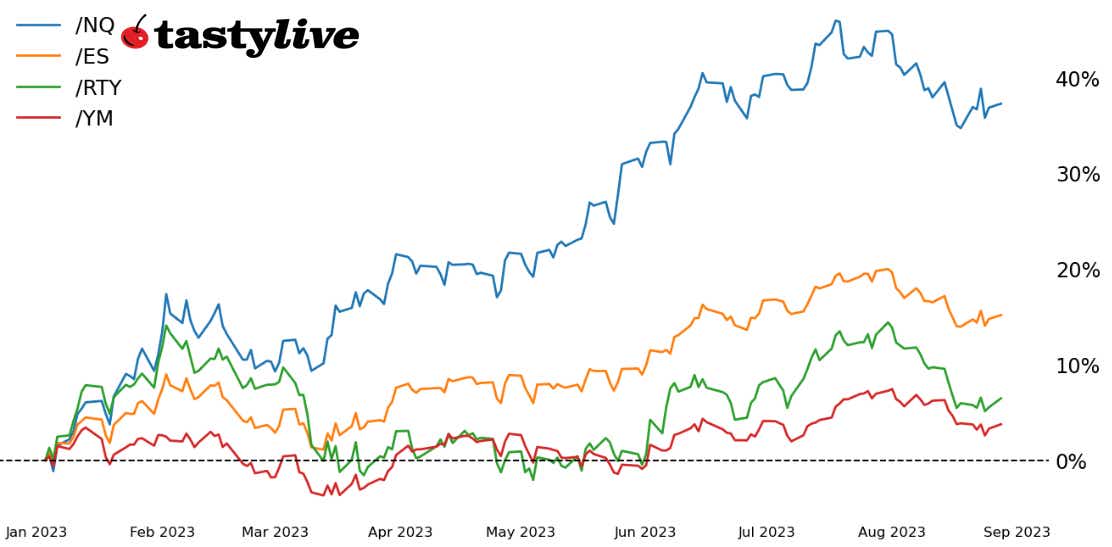
The rally that emerged from the Federal Reserve’s Jackson Hole Economic Policy Symposium continued at the start of the new week. Led higher by the Russell 2000 (/RTYU3), the four major U.S. equity indexes are continuing to build on developments last week.
At least from a technical perspective, not much has changed, seeing how it was noted just a week ago that “the S&P 500 (/ESU3) and the Russell 2000 have reached meaningful technical support that has been carved out over the past several months, bringing about a crossroads of sorts: the bleeding stops here, and a base forms for a turn higher; or this is merely a pit stop before a swing to fresh multi-month lows.”
/ES S&P 500 price technical analysis: daily chart (August 2022 to August 2023)
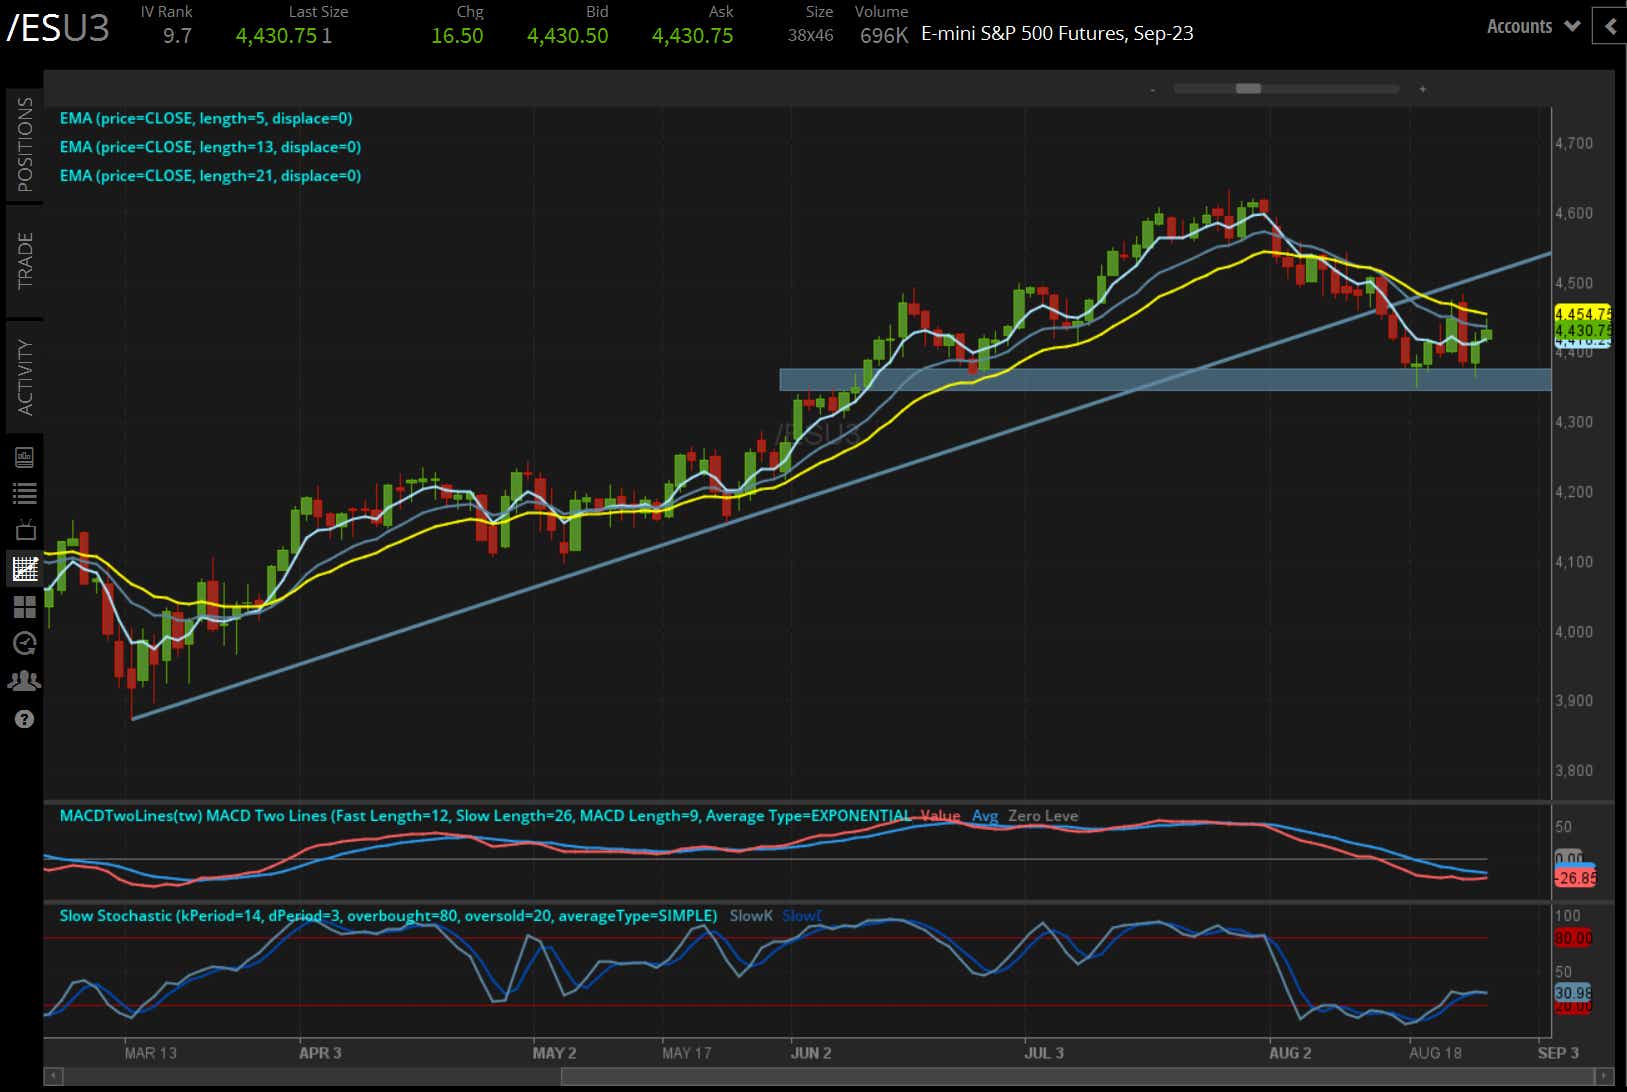
In the prior technical note, it was observed that “a morning candlestick pattern—a three-candlestick bottoming effort–may be forming in the area around the early-June swing highs and the late-June swing low, roughly 4335/65. Such a pattern would offer a technical reason to think a short-term low is forming.” Since then, no new monthly lows have been reached; however, Thursday’s bearish outside engulfing bar warns that upside could be curtailed in the near-term.
Momentum has started to neutralize. /ESU3 is back above its daily 5-EMA, but still below its daily 13- and 21-exponential moving averages (EMAs). The descent below its signal line of the moving average convergence /divergence (MACD) is slowing, while slow stochastics have already bounced out of oversold territory. Collectively, it may be the case that a range may be forming between the morning star candlestick cluster low and the outside engulfing bar high (4350/4485).
/NQ Nasdaq 100 price technical analysis: daily chart (August 2022 to August 2023)
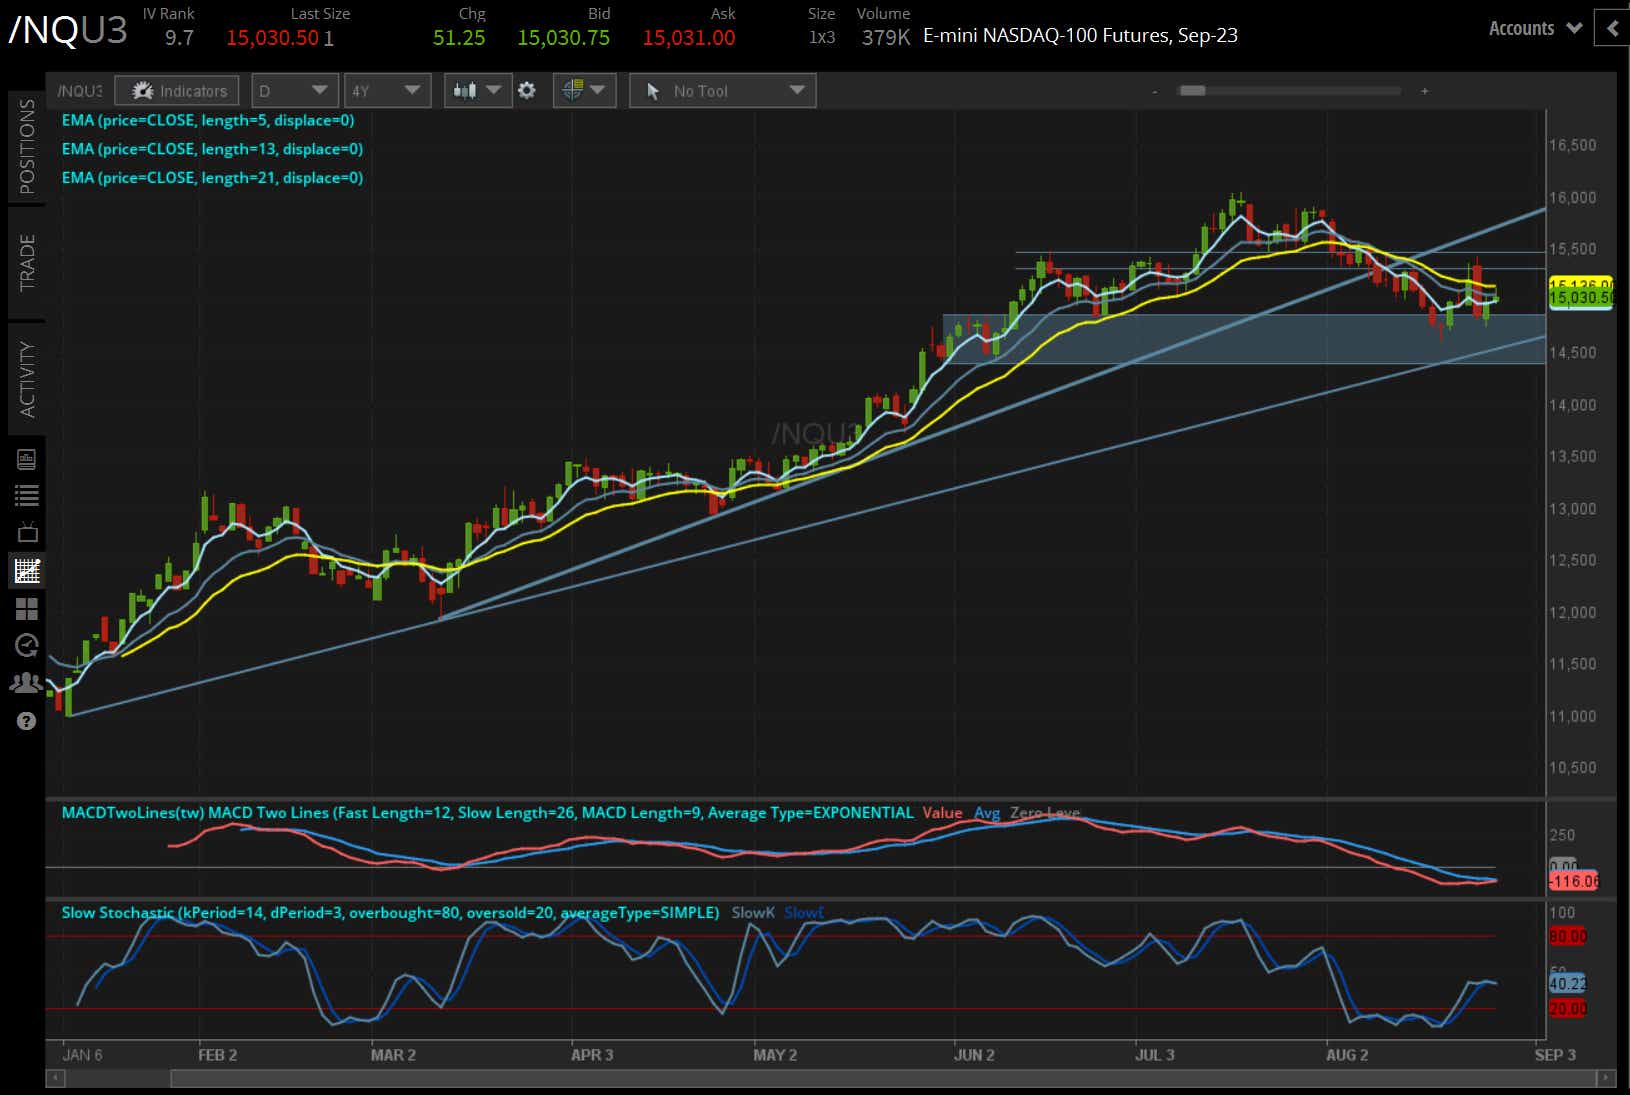
/NQU3 may have indeed formed a short-term low, but like /ESU3, the Thursday price action warns that overhead resistance lingers close by. This means a near-term range may be forming (14609/15418). Momentum is neutralizing in /NQU3 as well. The trend lower in MACD is abating, while slow stochastics have moved out of oversold territory. Meanwhile, the index is back above its daily 5-EMA but remains below its daily 13- and 21-EMAs.
/RTY Russell 2000 price technical analysis: daily chart (August 2022 to August 2023)
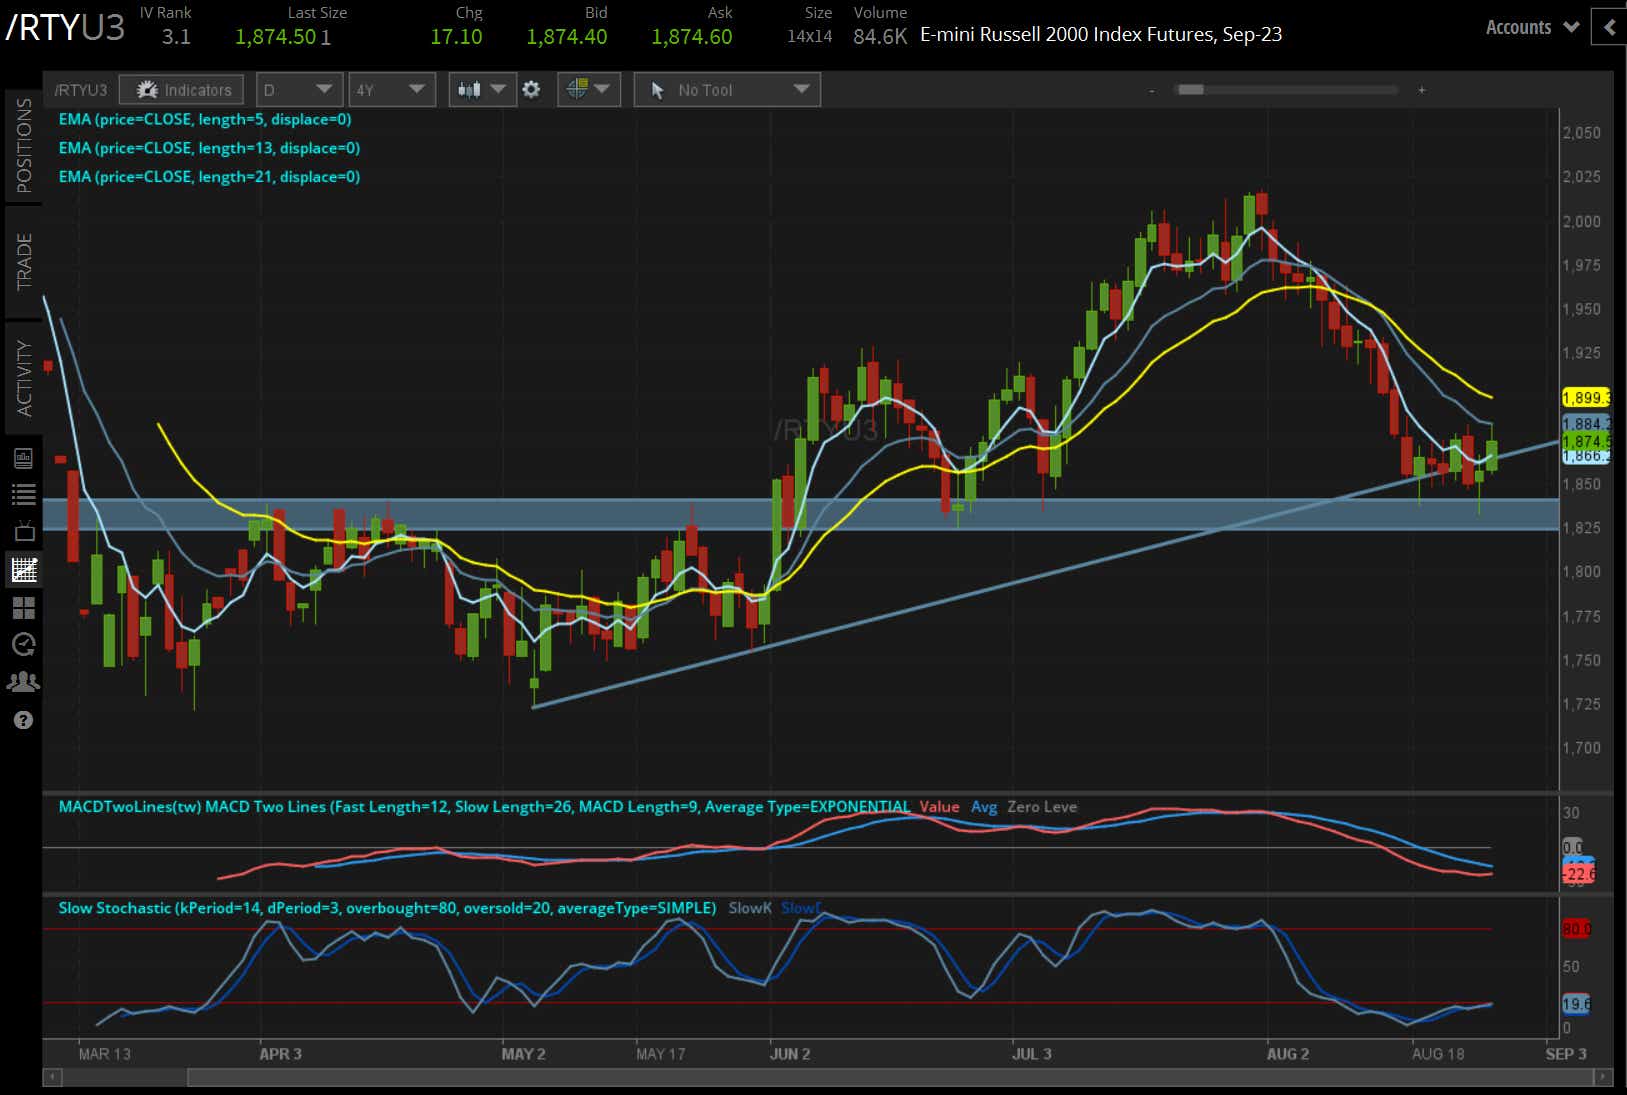
/RTYU3 may have the best case for a bottom having formed that will not only halt bearish momentum, but also lead to more meaningful upside. Unlike /ESU3 and /NQU3, /RTYU3 has already breached the outside engulfing bar high set on Thursday, negating the candle as a potential topping signal. In turn, it may be establishing a double bottom from the Aug. 18 and Aug. 25 swing lows in the 1825/45 area, which has been both support and resistance dating back to March. Coupled with a return above the trendline from the intramonth May swing lows, there are green shoots forming in /RTYU3 that is giving traders a workable low.
Christopher Vecchio, CFA, tastylive’s head of futures and forex, has been trading for nearly 20 years. He has consulted with multinational firms on FX hedging and lectured at Duke Law School on FX derivatives. Vecchio searches for high-convexity opportunities at the crossroads of macroeconomics and global politics. He hosts Futures Power Hour Monday-Friday and Let Me Explain on Tuesdays, and co-hosts Overtime, Monday-Thursday. @cvecchiofx
For live daily programming, market news and commentary, visit tastylive or the YouTube channels tastylive (for options traders), and tastyliveTrending for stocks, futures, forex & macro.
Trade with a better broker, open a tastytrade account today. tastylive, Inc. and tastytrade, Inc. are separate but affiliated companies.
Options involve risk and are not suitable for all investors. Please read Characteristics and Risks of Standardized Options before deciding to invest in options.
tastylive content is created, produced, and provided solely by tastylive, Inc. (“tastylive”) and is for informational and educational purposes only. It is not, nor is it intended to be, trading or investment advice or a recommendation that any security, futures contract, digital asset, other product, transaction, or investment strategy is suitable for any person. Trading securities, futures products, and digital assets involve risk and may result in a loss greater than the original amount invested. tastylive, through its content, financial programming or otherwise, does not provide investment or financial advice or make investment recommendations. Investment information provided may not be appropriate for all investors and is provided without respect to individual investor financial sophistication, financial situation, investing time horizon or risk tolerance. tastylive is not in the business of transacting securities trades, nor does it direct client commodity accounts or give commodity trading advice tailored to any particular client’s situation or investment objectives. Supporting documentation for any claims (including claims made on behalf of options programs), comparisons, statistics, or other technical data, if applicable, will be supplied upon request. tastylive is not a licensed financial adviser, registered investment adviser, or a registered broker-dealer. Options, futures, and futures options are not suitable for all investors. Prior to trading securities, options, futures, or futures options, please read the applicable risk disclosures, including, but not limited to, the Characteristics and Risks of Standardized Options Disclosure and the Futures and Exchange-Traded Options Risk Disclosure found on tastytrade.com/disclosures.
tastytrade, Inc. ("tastytrade”) is a registered broker-dealer and member of FINRA, NFA, and SIPC. tastytrade was previously known as tastyworks, Inc. (“tastyworks”). tastytrade offers self-directed brokerage accounts to its customers. tastytrade does not give financial or trading advice, nor does it make investment recommendations. You alone are responsible for making your investment and trading decisions and for evaluating the merits and risks associated with the use of tastytrade’s systems, services or products. tastytrade is a wholly-owned subsidiary of tastylive, Inc.
tastytrade has entered into a Marketing Agreement with tastylive (“Marketing Agent”) whereby tastytrade pays compensation to Marketing Agent to recommend tastytrade’s brokerage services. The existence of this Marketing Agreement should not be deemed as an endorsement or recommendation of Marketing Agent by tastytrade. tastytrade and Marketing Agent are separate entities with their own products and services. tastylive is the parent company of tastytrade.
tastyfx, LLC (“tastyfx”) is a Commodity Futures Trading Commission (“CFTC”) registered Retail Foreign Exchange Dealer (RFED) and Introducing Broker (IB) and Forex Dealer Member (FDM) of the National Futures Association (“NFA”) (NFA ID 0509630). Leveraged trading in foreign currency or off-exchange products on margin carries significant risk and may not be suitable for all investors. We advise you to carefully consider whether trading is appropriate for you based on your personal circumstances as you may lose more than you invest.
tastycrypto is provided solely by tasty Software Solutions, LLC. tasty Software Solutions, LLC is a separate but affiliate company of tastylive, Inc. Neither tastylive nor any of its affiliates are responsible for the products or services provided by tasty Software Solutions, LLC. Cryptocurrency trading is not suitable for all investors due to the number of risks involved. The value of any cryptocurrency, including digital assets pegged to fiat currency, commodities, or any other asset, may go to zero.
© copyright 2013 - 2026 tastylive, Inc. All Rights Reserved. Applicable portions of the Terms of Use on tastylive.com apply. Reproduction, adaptation, distribution, public display, exhibition for profit, or storage in any electronic storage media in whole or in part is prohibited under penalty of law, provided that you may download tastylive’s podcasts as necessary to view for personal use. tastylive was previously known as tastytrade, Inc. tastylive is a trademark/servicemark owned by tastylive, Inc.
Your privacy choices