S&P 500 and Nasdaq 100 Face Key Tests Ahead of Earnings

S&P 500 and Nasdaq 100 Face Key Tests Ahead of Earnings
The exchanges are testing resistance as earnings from the tech giants loom. Will they break higher or stall?
- Both the S&P 500 (/ESM5) and Nasdaq 100 (/NQM5) have traded to the topside of their post-Liberation Day trading ranges.
- The Russell 2000 (/RTYM5) is failing to clear an important threshold of technical resistance that has kept gains capped over the past three weeks.
- It’s a big week for earnings and the Nasdaq 100: Microsoft (MSFT), Meta Platforms (META), Amazon (AMZN), and Apple (AAPL) will report later this week.
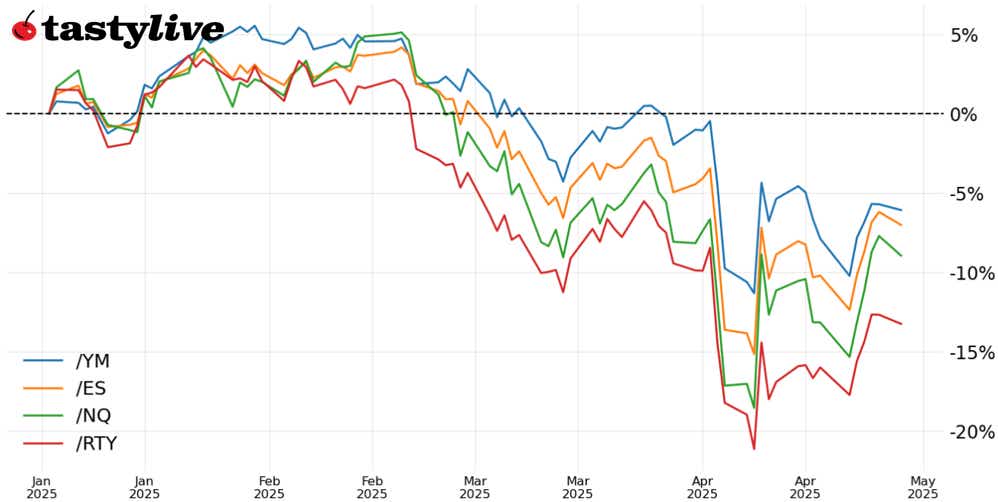
April has been nothing if not exciting from the trading perspective. A surge in volatility around the April 2 “Liberation Day” tariffs helped produce some of the largest single-day point moves in the S&P 500’s history: April 9 (+474.13) clocks in as No. 1 among largest point gains; April 4 (-322.44), April 3 (-274.45), and April 10 (-188.85) rank as the #2, #3, and #6 largest single-day point losses ever.
The end of April and start of May bring about a slew of major earnings releases—Microsoft (MSFT), Meta (META), Apple (AAPL) and Amazon (AMZN)—and significant macroeconomic events (nonfarm payrolls) that may help distract traders from the tariff talk that is otherwise dominating price action. A ‘humped’ VIX term structure (IVs lower in the near-term, rise towards mid-term, then decrease again longer-term) suggests markets are not out of the woods yet.
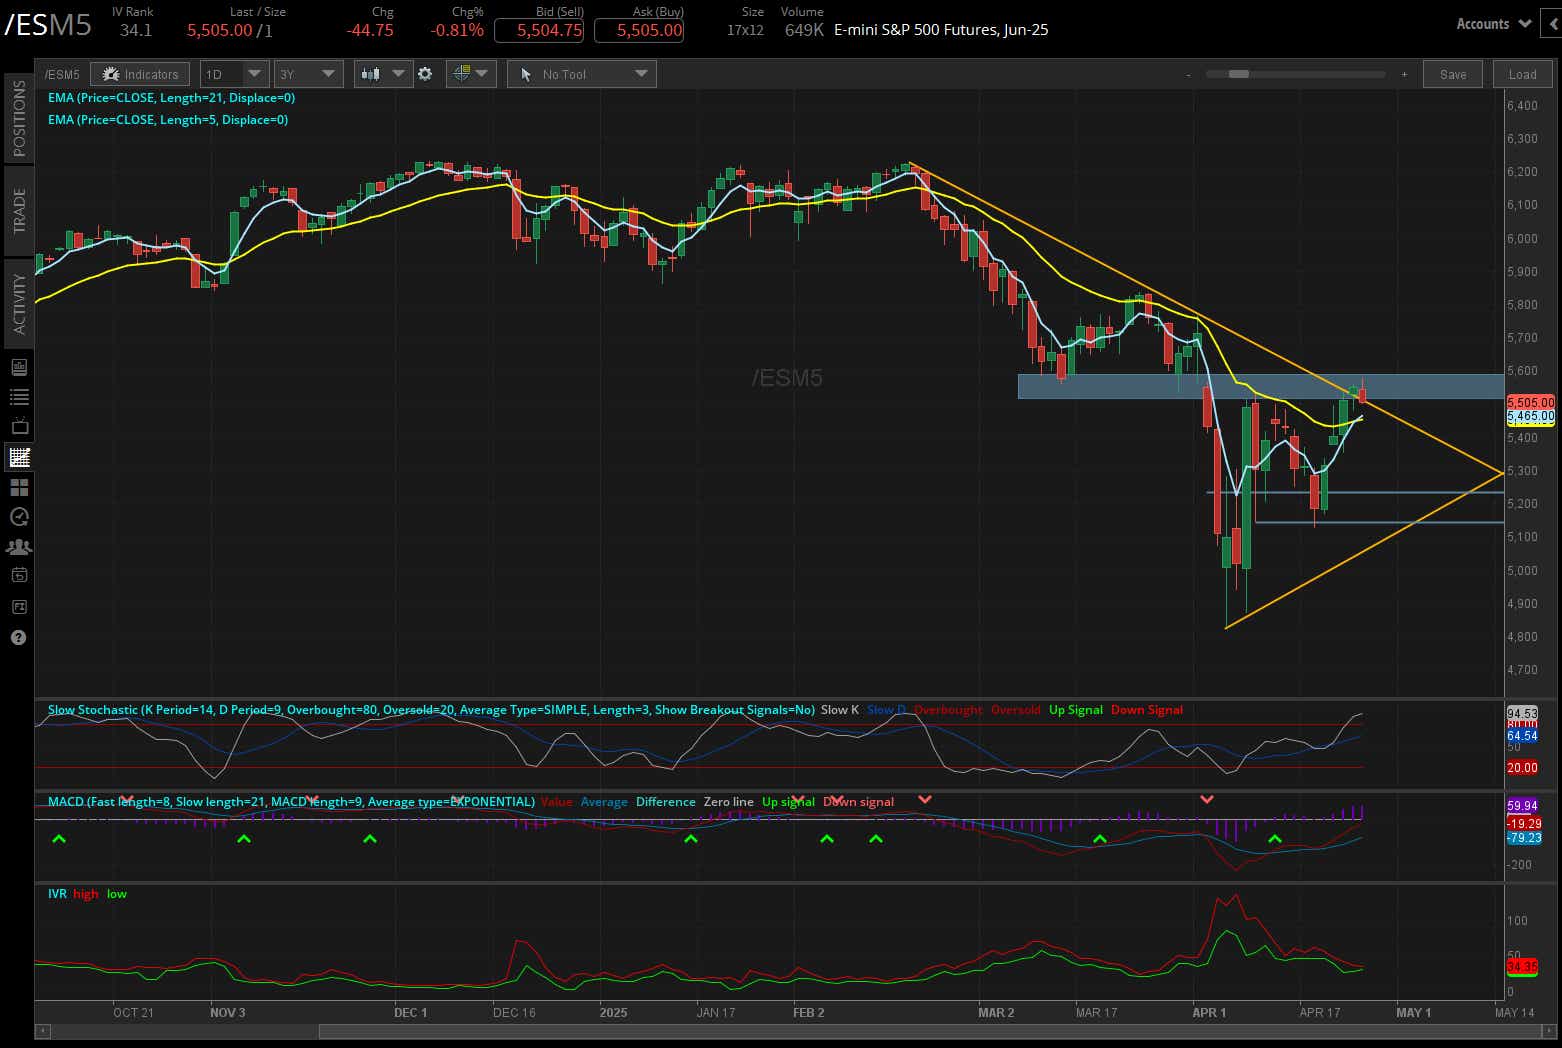
/ES S&P 500 Price Technical Analysis: Daily Chart (October 2024 to April 2025)
The S&P 500 (/ESM5) is struggling to break the downtrend from the February, March and April swing highs, losing steam around 5500/50 for a third session. This area is likewise where /ESM5 found support in March ahead of Liberation Day, a technical ‘line in the sand’ that has defined the topside of the wide trading range over the past month. Failure here, back into the downtrend, would suggest bulls have run out of ammunition.
That said, improved momentum may give dip buyers a technical reason to try to pick up the pieces early in the week. /ESM5 remains above its daily 5-, 13- and 21-EMAs, and the EMA cloud is in bullish sequential order. MACD is on the verge of crossing above its signal line, while Slow Stochastics are nestled in overbought territory—neither of which are signs of a bear market. The path of least resistance would appear to be chop, barring a decisive breakout above 5550.
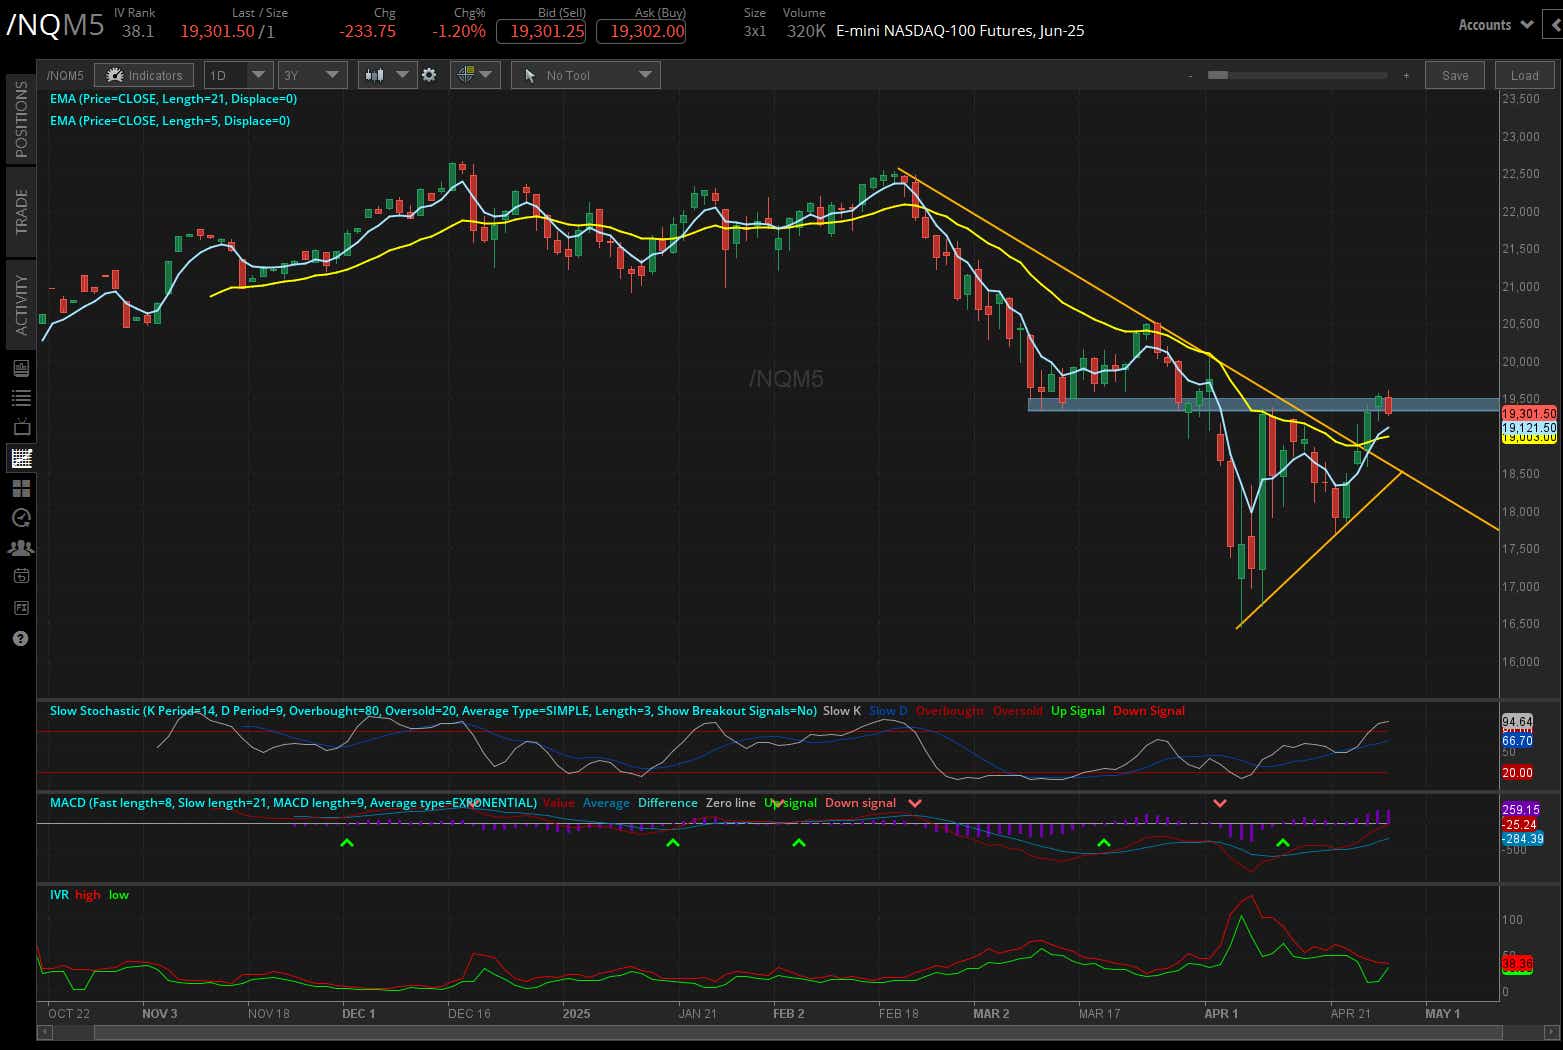
/NQ Nasdaq 100 Price Technical Analysis: Daily Chart (October 2024 to April 2025)
Like /ESM5, the Nasdaq 100 (/NQM5) is finding trouble around the lows carved out in March, which have since become resistance in post-Liberation Day trading. Similar to /ESM5, /NQM5 likewise has an improved momentum profile (EMA cloud, MACD and slow stochastics) that suggests a corner-of-sorts has been turned. Failure below 19000 would negate budding bullish technical sentiment. Close to the midpoint of the 2025 trading range, the prudent decision may ultimately be to stay directionally neutral in the short-term.
/RTY Russell 2000 Price Technical Analysis: Daily Chart (December 2024 to April 2025)
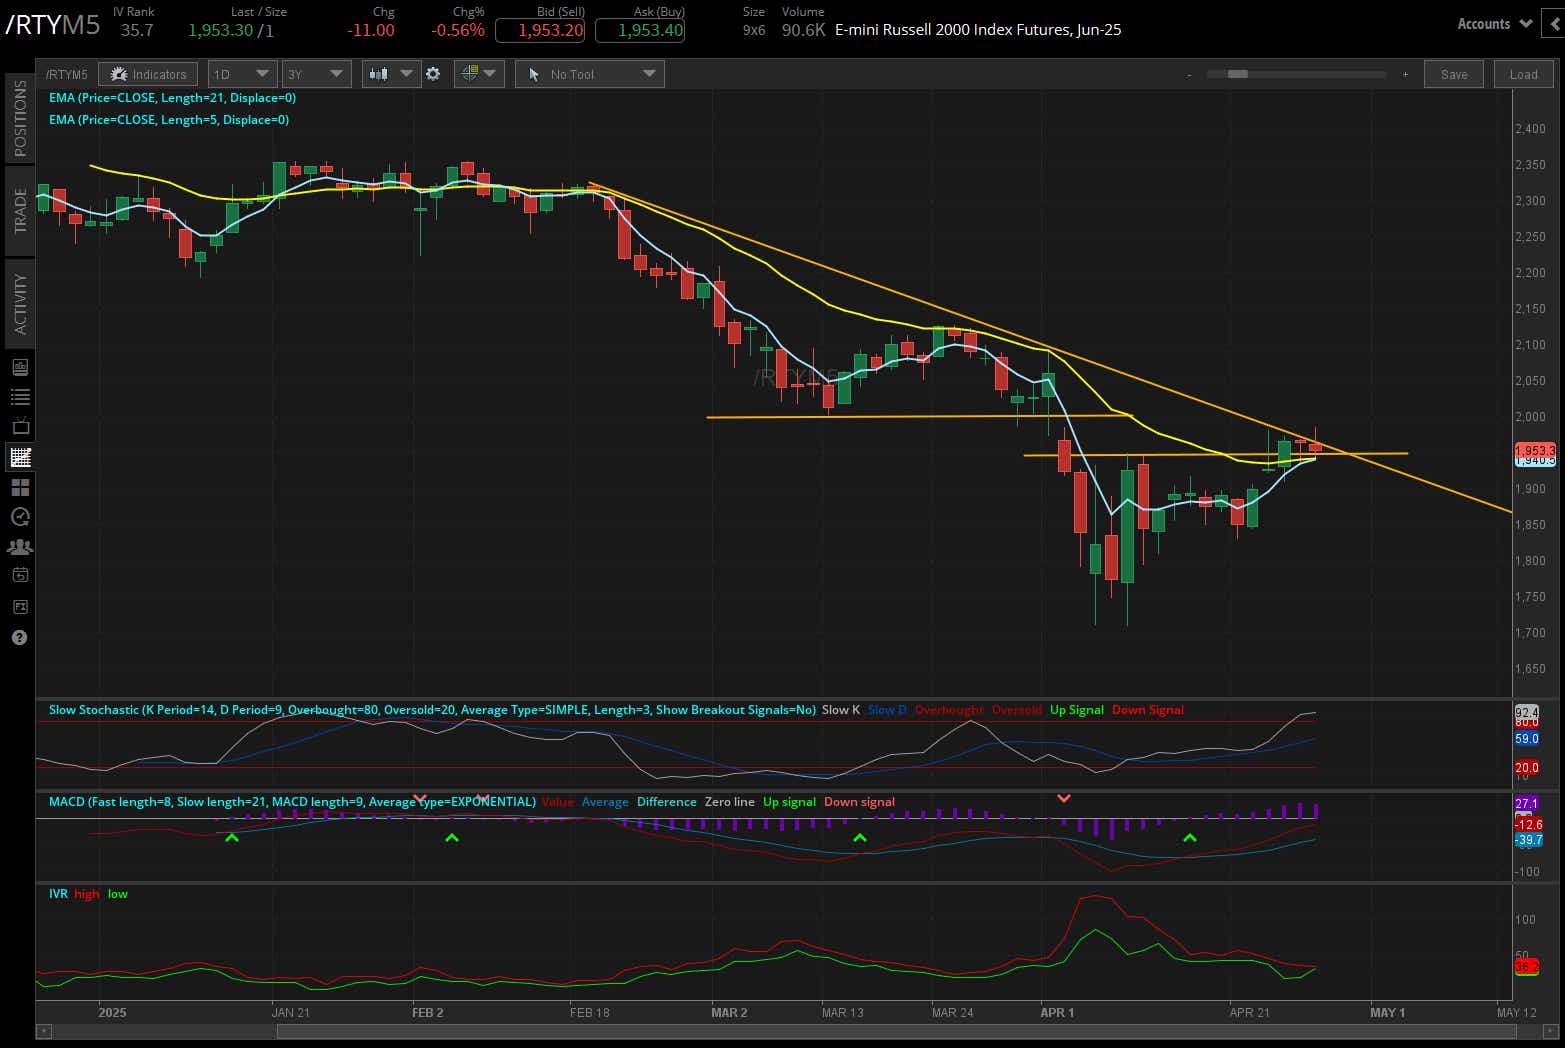
The Russell 2000 (/RTYM5) tells a familiar story: the downtrend from the yearly highs is being pressured but not yet hurdled; the March swing lows that preceded
Liberation Day are serving as resistance; yet momentum appears to be turning the corner in a more constructive manner. A closer look at today’s candlestick suggests that with a bit more weakness in the close, a bearish outside engulfing bar (or bearish key reversal) would be established, suggesting a near-term top.
That would be accomplished below 1937.8, which would likewise see /RTYM5 close below both its daily 5- and 21-EMAs.
Christopher Vecchio, CFA, tastylive’s head of futures and forex, has been trading for nearly 20 years. He has consulted with multinational firms on FX hedging and lectured at Duke Law School on FX derivatives. Vecchio searches for high-convexity opportunities at the crossroads of macroeconomics and global politics. He hosts Futures Power Hour Monday-Friday and Let Me Explain on Tuesdays, and co-hosts Overtime, Monday-Thursday. @cvecchiofx
For live daily programming, market news and commentary, visit tastylive or the YouTube channels tastylive (for options traders), and #tastyliveTrending for stocks, futures, forex & macro.
Trade with a better broker, open a tastytrade account today. tastylive Inc. and tastytrade Inc. are separate but affiliated companies.
Options involve risk and are not suitable for all investors. Please read Characteristics and Risks of Standardized Options before deciding to invest in options.
tastylive content is created, produced, and provided solely by tastylive, Inc. (“tastylive”) and is for informational and educational purposes only. It is not, nor is it intended to be, trading or investment advice or a recommendation that any security, futures contract, digital asset, other product, transaction, or investment strategy is suitable for any person. Trading securities, futures products, and digital assets involve risk and may result in a loss greater than the original amount invested. tastylive, through its content, financial programming or otherwise, does not provide investment or financial advice or make investment recommendations. Investment information provided may not be appropriate for all investors and is provided without respect to individual investor financial sophistication, financial situation, investing time horizon or risk tolerance. tastylive is not in the business of transacting securities trades, nor does it direct client commodity accounts or give commodity trading advice tailored to any particular client’s situation or investment objectives. Supporting documentation for any claims (including claims made on behalf of options programs), comparisons, statistics, or other technical data, if applicable, will be supplied upon request. tastylive is not a licensed financial adviser, registered investment adviser, or a registered broker-dealer. Options, futures, and futures options are not suitable for all investors. Prior to trading securities, options, futures, or futures options, please read the applicable risk disclosures, including, but not limited to, the Characteristics and Risks of Standardized Options Disclosure and the Futures and Exchange-Traded Options Risk Disclosure found on tastytrade.com/disclosures.
tastytrade, Inc. ("tastytrade”) is a registered broker-dealer and member of FINRA, NFA, and SIPC. tastytrade was previously known as tastyworks, Inc. (“tastyworks”). tastytrade offers self-directed brokerage accounts to its customers. tastytrade does not give financial or trading advice, nor does it make investment recommendations. You alone are responsible for making your investment and trading decisions and for evaluating the merits and risks associated with the use of tastytrade’s systems, services or products. tastytrade is a wholly-owned subsidiary of tastylive, Inc.
tastytrade has entered into a Marketing Agreement with tastylive (“Marketing Agent”) whereby tastytrade pays compensation to Marketing Agent to recommend tastytrade’s brokerage services. The existence of this Marketing Agreement should not be deemed as an endorsement or recommendation of Marketing Agent by tastytrade. tastytrade and Marketing Agent are separate entities with their own products and services. tastylive is the parent company of tastytrade.
tastyfx, LLC (“tastyfx”) is a Commodity Futures Trading Commission (“CFTC”) registered Retail Foreign Exchange Dealer (RFED) and Introducing Broker (IB) and Forex Dealer Member (FDM) of the National Futures Association (“NFA”) (NFA ID 0509630). Leveraged trading in foreign currency or off-exchange products on margin carries significant risk and may not be suitable for all investors. We advise you to carefully consider whether trading is appropriate for you based on your personal circumstances as you may lose more than you invest.
tastycrypto is provided solely by tasty Software Solutions, LLC. tasty Software Solutions, LLC is a separate but affiliate company of tastylive, Inc. Neither tastylive nor any of its affiliates are responsible for the products or services provided by tasty Software Solutions, LLC. Cryptocurrency trading is not suitable for all investors due to the number of risks involved. The value of any cryptocurrency, including digital assets pegged to fiat currency, commodities, or any other asset, may go to zero.
© copyright 2013 - 2026 tastylive, Inc. All Rights Reserved. Applicable portions of the Terms of Use on tastylive.com apply. Reproduction, adaptation, distribution, public display, exhibition for profit, or storage in any electronic storage media in whole or in part is prohibited under penalty of law, provided that you may download tastylive’s podcasts as necessary to view for personal use. tastylive was previously known as tastytrade, Inc. tastylive is a trademark/servicemark owned by tastylive, Inc.
Your privacy choices