Technical Analysis 101: Fibonacci Retracements and Extensions

Technical Analysis 101: Fibonacci Retracements and Extensions
Traders can identify levels of support and resistance on charts by using the Fibonacci sequence
- The Fibonacci sequence is a series of numbers that starts with 1 and 1, and then each number is the sum of the previous two.
- Traders use Fibonacci retracements to identify levels of support and resistance on charts.
- Fibonacci numbers are named after Leonardo Fibonacci the Italian mathematician who first wrote about them in the 1200s.
Traders use Fibonacci retracements to identify levels of support and resistance on charts and use Fibonacci extensions to identify price targets. But where do these numbers come from? What is their mathematical significance? In this article, we’ll explain the theory and foundations of using Fibonaccis for technical traders.
The origin of Fibonaccis
The Fibonacci numbers are named after Leonardo Fibonacci the Italian mathematician who first wrote about them in the 1200s. He published a book called “Liber Abaci” that introduced the numbers to the Western world, but they were already known in India since 200 BC.
The numbers start with 1 and each number is the sum of the two numbers before it. The Fibonacci sequence is as follows: 1, 1, 2, 3, 5, 8, 13, 21, 34, 55, 89, 144, etc.
One way to use Fibonaccis is to use them for measuring areas. The Fibonacci spiral (the “golden spiral”) is made of squares that follow the Fibonacci sequence, which is a series of numbers where each number is the sum of the previous two. The first two numbers are 1 and 1, so the spiral begins with two 1x1 squares. The next number is 2, so the next square is 2x2. The next number is 3, so the next square is 3x3, and so on. The spiral emerges when a curve is drawn through the corners of each new square. The diagram below illustrates this process:
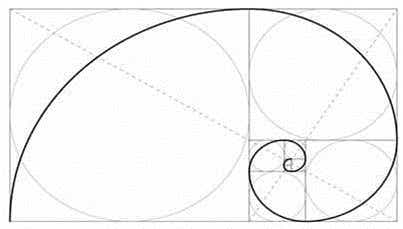
Fibonacci spirals ratios are found in the naturally occurring world: sunflowers have 34 spirals; daisies typically have 34, 55, or 89 petals; seashells take the form of the golden spiral, as do hurricanes; even galaxies have ratios that correspond to the Fibonacci spiral.
The Fibonacci math
The Fibonacci sequence is a series of numbers that starts with 1 and 1, and then each number is the sum of the previous two. For example, the next number is 1 + 1 = 2, then 1 + 2 = 3, then 2 + 3 = 5, and so on. These numbers are interesting by themselves, but they also have a special relationship with each other.
The relationship is called the Golden Ratio, and it is about 1.618. The Golden Ratio is the number you get when you divide a Fibonacci number by the one before it. For example, 5 / 3 = 1.666, 8 / 5 = 1.6, 13 / 8 = 1.625, and so on. The closer the Fibonacci numbers are to each other, the closer the ratio is to 1.618. The Golden Ratio is often written as the Greek letter ϕ “Phi”.
Some examples are:
a/b = ϕ
1597/987 = 1.61803
144/89 = 1.61797
21/13 = 1.615 (not very close for numbers 55 and lower)
Fibonacci retracements
Fibonacci uses ratios that are based on math to suggest possible zones of support and resistance in financial markets. These zones are not exact levels, but rather areas where price might bounce or reverse. Price does not always reach or respect these zones, so traders should be flexible and not expect precise levels. When placing stop and limit orders, traders should allow some room for price to move around the Fibonacci zone.
The most important levels to watch when using Fibonacci retracements are the 38.2% and 61.8%. The 50% level is not really a Fibonacci level, but many charting tools include it and many traders consider it a significant point (the halfway point of the measured range).
In your charting package, find the low and the high of the area you want to approximate support and resistance, like in the S&P 500 (/ES) from the October 2022 low to the July 2023 high:
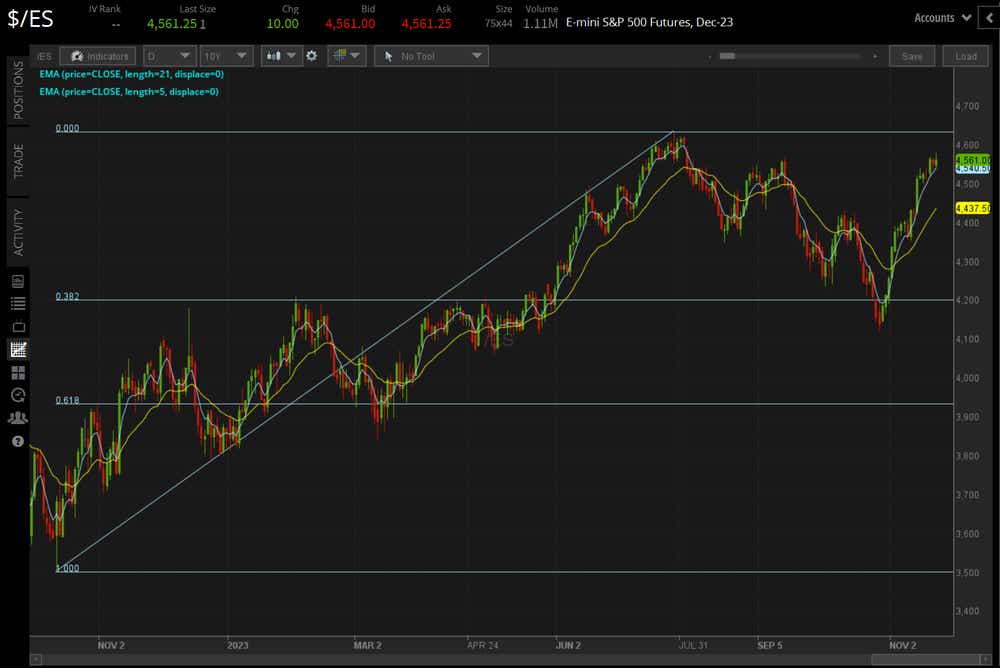
Note how the S&P 500’s decline in October 2023 reversed right near the 38.2% Fibonacci retracement of the October 2022 low/July 2023 high range.
Fibonacci extensions
Fibonacci numbers and ratios are also used to project possible future zones of support and resistance, where the trend might resume after a pullback from a strong initial move. This tool is called the Fibonacci extension or Fibonacci expansion, and it can be applied to any market.
To use the Fibonacci extension tool, you need to select it and then click on three points on the chart in this order:
For uptrends, the points are a low (A), high (B), low (C). For downtrends, the points are a high (A), low (B), high (C).
The start of the big initial move: The first point for the Fibonacci extension tool is point ‘A’ on the crude oil (/CL) chart from mid-2023 below. This point shows where the original/primary move began.
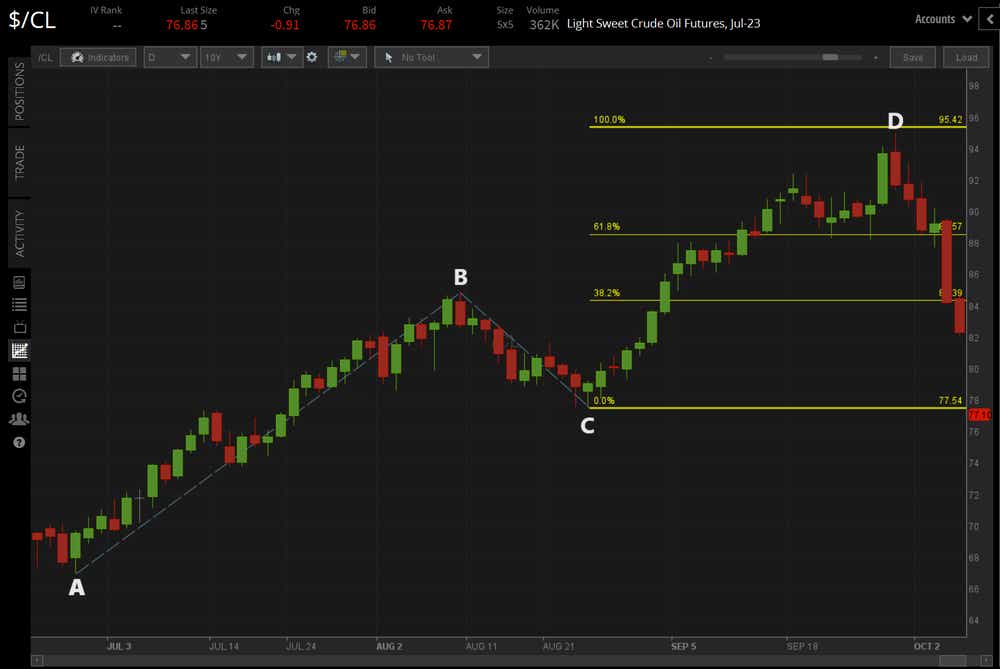
The end of the initial move and the start of the pullback: The second point for the Fibonacci extension tool is point ‘B’ on the chart. This point shows where the primary move ended, and the retracement started.
The end of the pullback—the swing low: The third and final point for the Fibonacci extension tool is point ‘C’ on the chart. This point shows where the retracement ended, and the trend resumed. We can be confident about this point because of the strong green candle that follows it.
The chart above shows the usual Fibonacci levels/ratios and also point ‘D’, which we added to show a 100% increase or ‘extension’ from the low of the pullback line BC in the direction of the primary move. The CD line is the same length as the AB line.
Christopher Vecchio, CFA, tastylive’s head of futures and forex, has been trading for nearly 20 years. He has consulted with multinational firms on FX hedging and lectured at Duke Law School on FX derivatives. Vecchio searches for high-convexity opportunities at the crossroads of macroeconomics and global politics. He hosts Futures Power Hour Monday-Friday and Let Me Explain on Tuesdays, and co-hosts Overtime, Monday-Thursday. @cvecchiofx
For live daily programming, market news and commentary, visit tastylive or the YouTube channels tastylive (for options traders), and tastyliveTrending for stocks, futures, forex & macro.
Trade with a better broker, open a tastytrade account today. tastylive, Inc. and tastytrade, Inc. are separate but affiliated companies.
Options involve risk and are not suitable for all investors. Please read Characteristics and Risks of Standardized Options before deciding to invest in options.
tastylive content is created, produced, and provided solely by tastylive, Inc. (“tastylive”) and is for informational and educational purposes only. It is not, nor is it intended to be, trading or investment advice or a recommendation that any security, futures contract, digital asset, other product, transaction, or investment strategy is suitable for any person. Trading securities, futures products, and digital assets involve risk and may result in a loss greater than the original amount invested. tastylive, through its content, financial programming or otherwise, does not provide investment or financial advice or make investment recommendations. Investment information provided may not be appropriate for all investors and is provided without respect to individual investor financial sophistication, financial situation, investing time horizon or risk tolerance. tastylive is not in the business of transacting securities trades, nor does it direct client commodity accounts or give commodity trading advice tailored to any particular client’s situation or investment objectives. Supporting documentation for any claims (including claims made on behalf of options programs), comparisons, statistics, or other technical data, if applicable, will be supplied upon request. tastylive is not a licensed financial adviser, registered investment adviser, or a registered broker-dealer. Options, futures, and futures options are not suitable for all investors. Prior to trading securities, options, futures, or futures options, please read the applicable risk disclosures, including, but not limited to, the Characteristics and Risks of Standardized Options Disclosure and the Futures and Exchange-Traded Options Risk Disclosure found on tastytrade.com/disclosures.
tastytrade, Inc. ("tastytrade”) is a registered broker-dealer and member of FINRA, NFA, and SIPC. tastytrade was previously known as tastyworks, Inc. (“tastyworks”). tastytrade offers self-directed brokerage accounts to its customers. tastytrade does not give financial or trading advice, nor does it make investment recommendations. You alone are responsible for making your investment and trading decisions and for evaluating the merits and risks associated with the use of tastytrade’s systems, services or products. tastytrade is a wholly-owned subsidiary of tastylive, Inc.
tastytrade has entered into a Marketing Agreement with tastylive (“Marketing Agent”) whereby tastytrade pays compensation to Marketing Agent to recommend tastytrade’s brokerage services. The existence of this Marketing Agreement should not be deemed as an endorsement or recommendation of Marketing Agent by tastytrade. tastytrade and Marketing Agent are separate entities with their own products and services. tastylive is the parent company of tastytrade.
tastyfx, LLC (“tastyfx”) is a Commodity Futures Trading Commission (“CFTC”) registered Retail Foreign Exchange Dealer (RFED) and Introducing Broker (IB) and Forex Dealer Member (FDM) of the National Futures Association (“NFA”) (NFA ID 0509630). Leveraged trading in foreign currency or off-exchange products on margin carries significant risk and may not be suitable for all investors. We advise you to carefully consider whether trading is appropriate for you based on your personal circumstances as you may lose more than you invest.
tastycrypto is provided solely by tasty Software Solutions, LLC. tasty Software Solutions, LLC is a separate but affiliate company of tastylive, Inc. Neither tastylive nor any of its affiliates are responsible for the products or services provided by tasty Software Solutions, LLC. Cryptocurrency trading is not suitable for all investors due to the number of risks involved. The value of any cryptocurrency, including digital assets pegged to fiat currency, commodities, or any other asset, may go to zero.
© copyright 2013 - 2026 tastylive, Inc. All Rights Reserved. Applicable portions of the Terms of Use on tastylive.com apply. Reproduction, adaptation, distribution, public display, exhibition for profit, or storage in any electronic storage media in whole or in part is prohibited under penalty of law, provided that you may download tastylive’s podcasts as necessary to view for personal use. tastylive was previously known as tastytrade, Inc. tastylive is a trademark/servicemark owned by tastylive, Inc.
Your privacy choices