VWAP: What is it and How to Trade it

VWAP: What is it and How to Trade it
Here’s a guide to understanding and calculating volume-weighted average price
- What is the volume-weighted average price (VWAP)?
- Here’s how to calculate VWAP and VWAP bands.
- How and why do institutional traders use VWAP?
- VWAP trading strategies: How to trade off VWAP.
The volume-weighted average price, or VWAP, is a technical analysis indicator that shows the average price weighted by volume. It looks like a simple moving average, but it incorporates volume into its calculation.
Because the volume of an asset can change from day to day for many reasons—economic events and earnings reports, for example—the VWAP resets at the start of each trading day. This ensures a clean and undistorted signal.
Consequently, VWAP is used primarily as an intraday indicator on minute-based timeframes like one-minute, five-minute or 15-minute. That makes the indicator most useful to those looking to enter and exit a trade within a single session. Institutional traders also use the VWAP, and we’ll get into the why and how later.
How is VWAP calculated?
Before we talk about how to trade using the VWAP, let’s look at how it is calculated to get a basic understanding of the math behind it. Luckily, it’s a fairly straightforward indicator and the platform handles the work for us.

Steps to calculate VWAP:
Let’s say we are calculating VWAP for a one-minute chart.
Add the high, low and close for each period on the chart and then divide by three. This gives you the price used in the formula, sometimes referred to as the typical price.
Multiply the price by the volume for the period.
Sum the product of volume and price for all periods.
Sum the volume for all periods.
Divide the cumulative totals to get the VWAP.
The product of volume and price and volume throughout the day are cumulative, meaning those values are summed with the previous values until the trading session ends. Remember, this calculation resets at the start of each trading day.
Because the calculation aggregates the same underlying data, the VWAP stays consistent whether it is plotted on a one-minute chart or any other intraday timeframe. This consistency strengthens the indicator’s credibility because every active investor is seeing the same VWAP.
VWAP bands: What are they and how are they used?
The VWAP indicator displays two bands by default: An upper band and a lower band.
These bands represent a specific number of standard deviations away from the VWAP, typically two. They’re essentially identical to Bollinger bands.
A standard deviation measures the dispersion of data relative to the mean, represented by the VWAP. Therefore, these bands will expand when prices are volatile and contract when prices are calm.
These bands are close together at the start of the trading day because of the limited amount of data, leading to less variability. Because of this phenomenon, the VWAP typically doesn’t provide a reliable trading signal at the start of trading. I personally wait 15 minutes before making any assumptions.
We’ll talk about how these bands can be incorporated into our overall VWAP trading strategies below.
Institutional traders and VWAP
Institutional investors often use VWAP to buy and sell securities.
Citadel, one of the world’s largest and most successful hedge funds, uses VWAP to execute orders in the market.
Kenneth Griffin, Citadel’s Founder and Chief Executive Officer, spoke before the U.S. House of Representatives in 2021. When asked how Citadel executes order for clients Mr. Griffin said, “virtually all trades executed by institutional investors are in the form of program trades such as volume-weighted average price (VWAP) and other algorithmic trades.”
Selling or buying a large quantity of shares in a single order would result in slippage and other inefficiencies.
Instead, orders are sliced into blocks and sold at or slightly above the VWAP or bought at or slightly below the VWAP. This ensures a fair execution price while reducing volatility.
If institutions bought above the VWAP, it would likely push the price up quickly and make it more expensive for the next order block. This is why prices can revert toward the VWAP throughout the trading day.
Considerations before trading the VWAP
Ten different traders can look at a chart with a VWAP, and they’ll all see the same thing, but it’s unlikely they would place the same trades. That’s because VWAP is an indicator, not a strategy.
Below, we’ll go over some of the more orthodox strategies for trading VWAP.
You’ll notice that the examples are all equities. This is because trading hours in the futures market are longer, and volume is spread out more throughout the day, reducing VWAP’s reliability.
Take-profit and stop-loss levels are also highly subjective and depend on a trader’s risk profile. Some use defined risk rules such as a 1:2 or 1:3 risk-reward ratio, while others might use the VWAP or bands to generate sell or buy signals. Some traders like to use lows or highs from the previous trading day and so on.
One aside before we dive in. Traders typically incorporate several indicators into their strategy. VWAP traders are often keen on using volume profile, which is a price-based representation of volume for a specific period. We won’t include that in the examples, but you can read about the volume profile here.
VWAP as a trend indicator
Using the VWAP to identify intraday trends is likely the most popular way to trade the indicator.
If prices are above the VWAP at the start of the trading day, it can indicate a bullish trend. Conversely, prices falling below the VWAP point to a bearish trend.
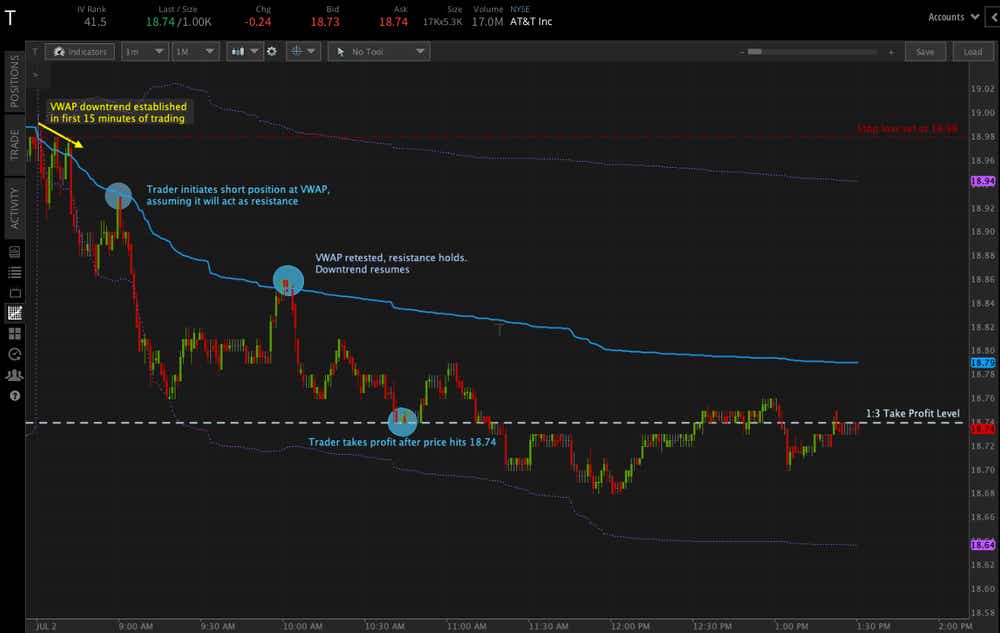
Let’s look at a one-minute chart of AT&T (T) to see how a VWAP trend trader would potentially implement the strategy.

Prices fall at the open, and a downtrend is established in the first 15 minutes of trading. Active investors focus on entering short positions.
Prices retrace to VWAP one hour into the trading day, which is seen as resistance. Active investors initiate a short position at 18.92.
The investor sets a stop-loss at the open price of 18.98, risking 0.06 per share, and a take-profit level at 18.7—a 1:3 risk-reward ratio.
Prices resume downtrend before retesting and failing at VWAP an hour after short is put on, confirming resistance.
The investor hits the 1:3 take-profit level after about one hour and 45 minutes and exits the trade.
**remember that take-profit and stop-loss levels vary among traders. To cite two examples, some use a 1:2 risk-reward ratio, while others might set their take profit at the previous day’s low.**
VWAP mean reversion strategy
Mean reversion trading is another popular strategy of VWAP traders. Playing this strategy, they wait for prices to deviate from the VWAP, preferably to or beyond the standard deviation band. Once prices reach that level, they place a trade betting prices will revert to the VWAP.
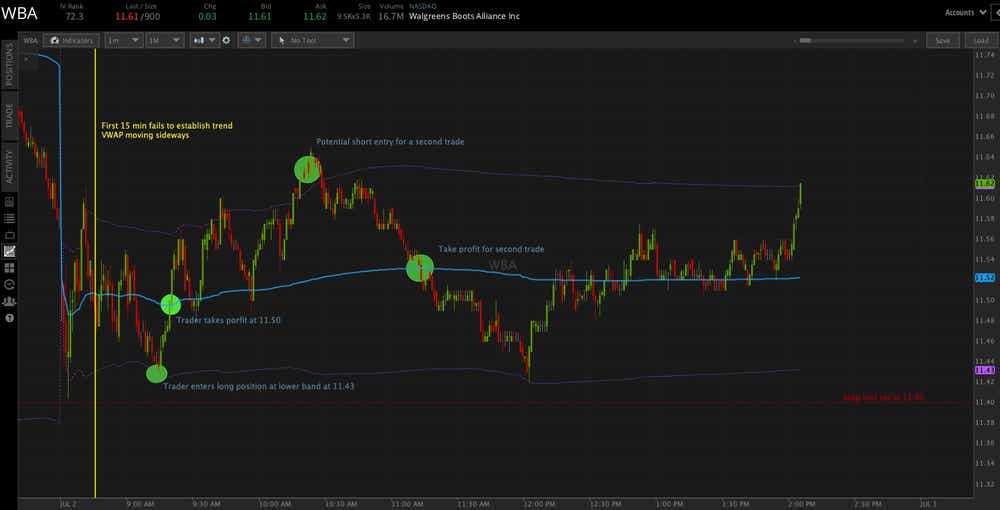
Let’s look at a one-minute chart of Walgreens (WBA) to see this strategy in action.

A trend fails to establish in the first 15 minutes of trading as price swings below and above VWAP.
Prices hit the lower band; The trader takes long position at 11.43.
The trader sets stop-loss at the low of the day 11.40, risking 0.03 per share and aims to take profit at VWAP.
Prices revert to VWAP, and the trader takes profit at 11.50, gaining 0.07 per share.
Prices then rise above the upper band several times. A mean reversion trader would likely see this as a short opportunity and bet on a return to the VWAP, which ended up playing out in our example above. A third trade offers another reversion when prices return to VWAP after testing the lower band.
VWAP support and resistance
Another VWAP trading strategy is to enter positions at the VWAP, betting that it will act as support or resistance. This is like the mean reversion strategy, except here we are entering positions at the VWAP and exiting positions at the bands. Instead of a reversion, we are betting on an expansion.
Like the other strategies, we filter out the first 15 minutes so our signals can clear up with more data. If no clear trend is established, we are unlikely to trade this as a trend day. After that, we want to look for the VWAP to act as support at least two or three times before trading on the assumption.
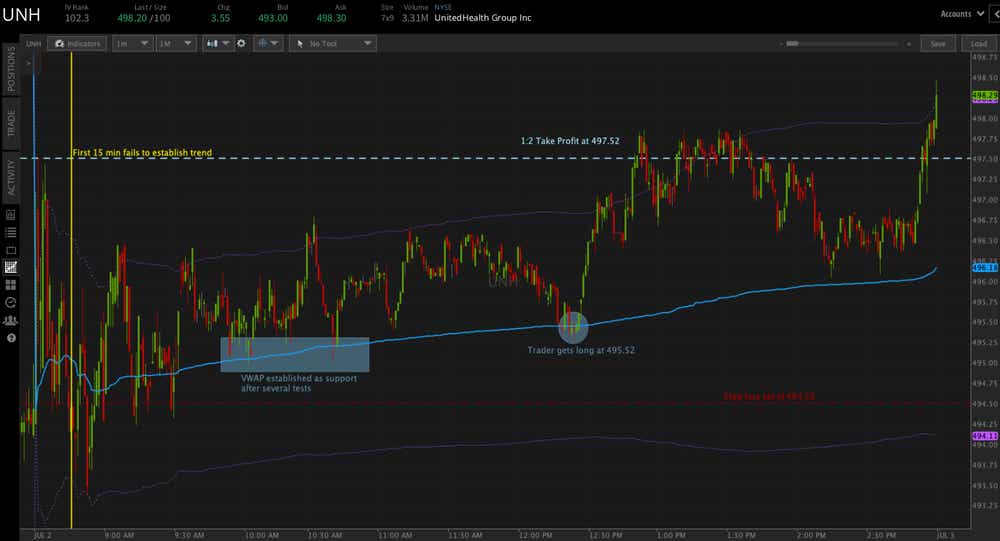
Let’s look at a one-minute chart of UnitedHealth Group (UNH) to view the strategy in action.

A trend fails to establish in first 15 minutes of trading.
VWAP acts as support several times through morning trading. The trader now looks for long trades at VWAP.
The trader takes long position as prices retest VWAP in afternoon trading at 495.52. The trader sets stop-loss at 494.52 and take-profit at 497.52—a 1:2 risk-reward.
Prices rise from VWAP and rise above upper band, triggering the take profit at 497.52.
VWAP takeaways
The volume-weighted average price is an indicator that shows the average price of an asset weighted by volume. It is used by institutional and retail traders alike.
To get VWAP: Multiply the average of the high, low, and close prices for the period by the volume of shares traded during that period. Then, sum these values for all periods and divide by the cumulative volume traded.
VWAP resets at the start of each trading day to ensure an undistorted and clean signal.
As a result, intraday timeframes work best for VWAP analysis.
It is best suited for trading stocks, but it can work in the futures market too.
Standard deviation bands can offer an important compliment to the indicator.
While VWAP serves as an objective indicator, the strategies traders employ based on it are inherently subjective. There's no single right or wrong way to use it.
You can complement VWAP with other indicators like the volume profile.
Thomas Westwater, a tastylive financial writer and analyst, has eight years of markets and trading experience. @fxwestwater
For live daily programming, market news and commentary, visit tastylive or the YouTube channels tastylive (for options traders), and tastyliveTrending for stocks, futures, forex & macro.
Trade with a better broker, open a tastytrade account today. tastylive, Inc. and tastytrade, Inc. are separate but affiliated companies.
Options involve risk and are not suitable for all investors. Please read Characteristics and Risks of Standardized Options before deciding to invest in options.
tastylive content is created, produced, and provided solely by tastylive, Inc. (“tastylive”) and is for informational and educational purposes only. It is not, nor is it intended to be, trading or investment advice or a recommendation that any security, futures contract, digital asset, other product, transaction, or investment strategy is suitable for any person. Trading securities, futures products, and digital assets involve risk and may result in a loss greater than the original amount invested. tastylive, through its content, financial programming or otherwise, does not provide investment or financial advice or make investment recommendations. Investment information provided may not be appropriate for all investors and is provided without respect to individual investor financial sophistication, financial situation, investing time horizon or risk tolerance. tastylive is not in the business of transacting securities trades, nor does it direct client commodity accounts or give commodity trading advice tailored to any particular client’s situation or investment objectives. Supporting documentation for any claims (including claims made on behalf of options programs), comparisons, statistics, or other technical data, if applicable, will be supplied upon request. tastylive is not a licensed financial adviser, registered investment adviser, or a registered broker-dealer. Options, futures, and futures options are not suitable for all investors. Prior to trading securities, options, futures, or futures options, please read the applicable risk disclosures, including, but not limited to, the Characteristics and Risks of Standardized Options Disclosure and the Futures and Exchange-Traded Options Risk Disclosure found on tastytrade.com/disclosures.
tastytrade, Inc. ("tastytrade”) is a registered broker-dealer and member of FINRA, NFA, and SIPC. tastytrade was previously known as tastyworks, Inc. (“tastyworks”). tastytrade offers self-directed brokerage accounts to its customers. tastytrade does not give financial or trading advice, nor does it make investment recommendations. You alone are responsible for making your investment and trading decisions and for evaluating the merits and risks associated with the use of tastytrade’s systems, services or products. tastytrade is a wholly-owned subsidiary of tastylive, Inc.
tastytrade has entered into a Marketing Agreement with tastylive (“Marketing Agent”) whereby tastytrade pays compensation to Marketing Agent to recommend tastytrade’s brokerage services. The existence of this Marketing Agreement should not be deemed as an endorsement or recommendation of Marketing Agent by tastytrade. tastytrade and Marketing Agent are separate entities with their own products and services. tastylive is the parent company of tastytrade.
tastyfx, LLC (“tastyfx”) is a Commodity Futures Trading Commission (“CFTC”) registered Retail Foreign Exchange Dealer (RFED) and Introducing Broker (IB) and Forex Dealer Member (FDM) of the National Futures Association (“NFA”) (NFA ID 0509630). Leveraged trading in foreign currency or off-exchange products on margin carries significant risk and may not be suitable for all investors. We advise you to carefully consider whether trading is appropriate for you based on your personal circumstances as you may lose more than you invest.
tastycrypto is provided solely by tasty Software Solutions, LLC. tasty Software Solutions, LLC is a separate but affiliate company of tastylive, Inc. Neither tastylive nor any of its affiliates are responsible for the products or services provided by tasty Software Solutions, LLC. Cryptocurrency trading is not suitable for all investors due to the number of risks involved. The value of any cryptocurrency, including digital assets pegged to fiat currency, commodities, or any other asset, may go to zero.
© copyright 2013 - 2025 tastylive, Inc. All Rights Reserved. Applicable portions of the Terms of Use on tastylive.com apply. Reproduction, adaptation, distribution, public display, exhibition for profit, or storage in any electronic storage media in whole or in part is prohibited under penalty of law, provided that you may download tastylive’s podcasts as necessary to view for personal use. tastylive was previously known as tastytrade, Inc. tastylive is a trademark/servicemark owned by tastylive, Inc.