Volume Profile: What it is and how to trade it

Volume Profile: What it is and how to trade it
It’s displayed on a chart with each bar representing the aggregated volume traded at specific price levels
The volume profile is an indicator that displays volume by price instead of time.
Traders should know the components of the volume indicator.
We’re including some basic strategies for trading the volume profile.
What is the volume profile?
The volume profile is a charting indicator that displays the volume of a stock, not by a specific time period—like traditional volume—but by price.
On a chart, it is displayed as a horizontal histogram, with each bar representing the aggregated volume traded at specific price levels.
In contrast, the traditional volume indicator aggregates and displays the volume traded over specific time periods (e.g., day, hour, month). Shorter time frames are more useful for short-term trading—such as day or swing trading—whereas longer time frames can help identify broader market trends.
The volume profile indicator can use multiple time frames to display the volume traded at each price level, including minute, hour, day, week, month and even for the current option expiration.
While it isn’t as well-known as the traditional volume indicator, it is a commonly used market indicator that has gained popularity in recent years.
Components of the volume profile indicator
There are several basic components of the volume profile indicator that we will break down before talking about how to trade off it.
Point of control: The point of control, or POC, is the level where the most volume has been traded. This is displayed by default as the red line on the chart.
The POC, by default, represents 70% of the total volume traded within the time period. This is used because it nearly represents 68.2% of the total volume traded—which is a one standard deviation move from the mean.
Value area: The value area, or VA, represents the area where, by default, 70% of the volume has been traded within the specified period.
Value area high: The value area high, or VAH, marks the top range of the value area. This is shown as the top yellow line.
Value area low: The value area low, or VAL, marks the bottom range of the value area. This is shown as the bottom yellow line.
Profile high: The profile high displays the highest price traded within the specified time period.
Profile low: The profile low displays the lowest price traded within the specified time period.
Trading the volume profile
In essence, the volume profile represents fair value (within the value area) and unfair value (outside the value area). Still, traders have developed endless ways to trade the volume profile, but we will stick to the fundamentals to get started.
The indicator can be used on any asset, and although mostly inconsequential to trading the indicator, it’s important to point out that the calculations differ between stocks and futures.
For stocks or exchange-traded funds (ETFs), such as SPY, for example, the calculation uses the volume traded. Futures, like the E-Mini S&P 500 contract (/ES), use the tick volume.
Support and resistance using the value area
Because the value area (VA) represents where 70% of volume has traded, prices within the VA tend to see fewer volatile moves because there is a lot of liquidity.
On the other hand, prices outside the value area tend to see sharper moves because there is less liquidity.
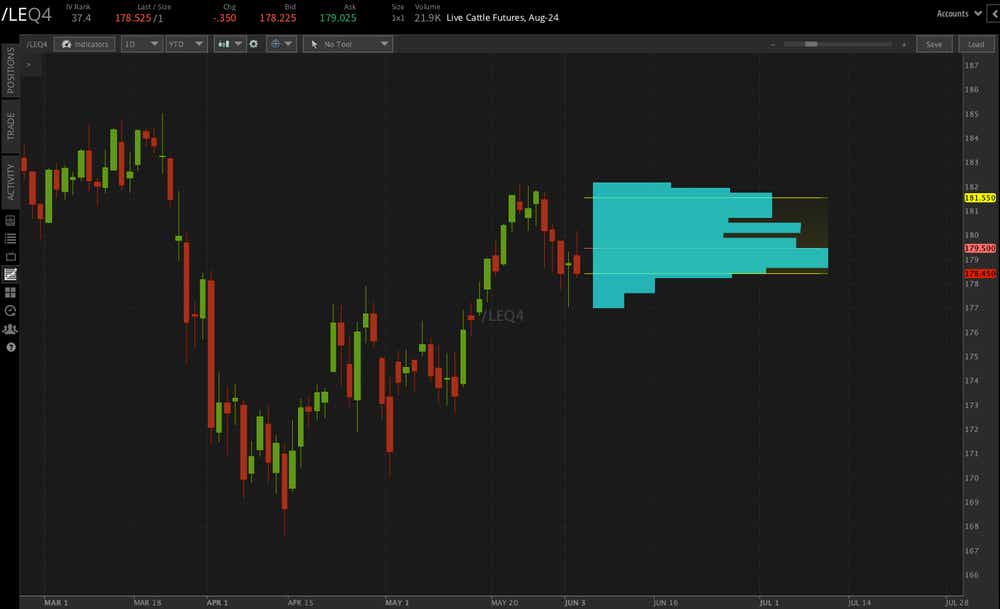
The value area high (VAH) is typically seen as an area of potential resistance, offering a signal to sell. The chart below shows a daily candlestick price chart for live cattle futures (/LE) with a volume profile using the options expiration for the time per profile.
Notice that prices started to stall near the VAH. Traders started to sell at those levels, reversing the previous rally.
Price fell from the VAH, before reaching the value area low (VAL), where support was found. Just as the VAH represents potential resistance, the VAL marks an area of potential support. That said, prices can often be seen making retracements from VAH’s to VAL’s, like we see in the live cattle futures chart.
Breakouts from the value area
Another signal traders look for when trading the volume profile is a break above or below the value area. When prices make a decisive break above or below the VA (i.e., a daily/hourly close above or below the VA), traders may go long or short, speculating that the price movement will accelerate given the lower liquidity outside the VA.
In other words, a move below the VA shows aggression from sellers, while a move above shows buyers are becoming more aggressive in the search for new prices.
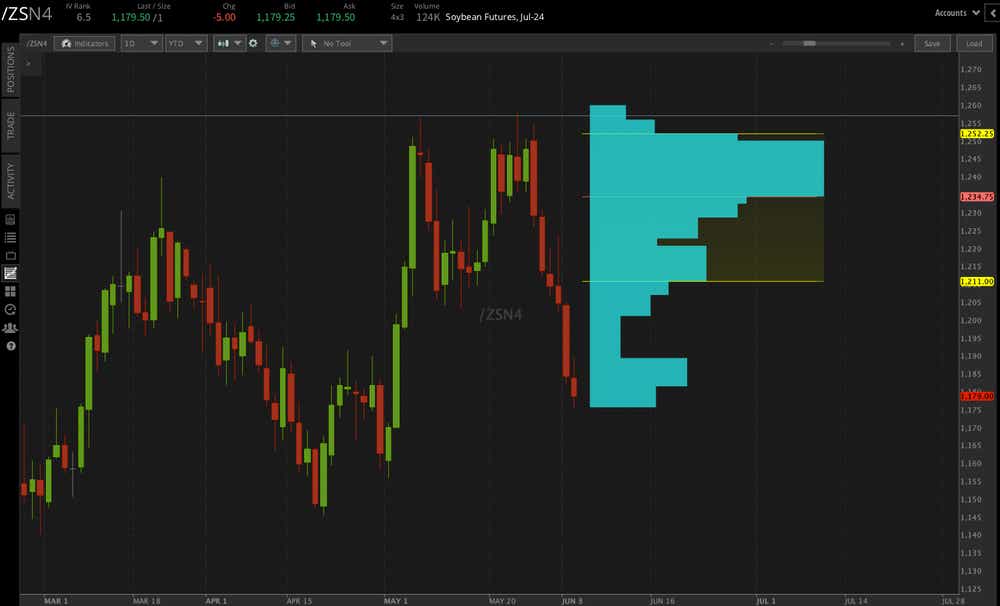
This type of trade played out in the soybeans futures contract (/ZS) in the chart below. Notice that prices made a daily close below the VA and subsequently sold off sharply in the following days.
We also see that before the breakdown soybean prices saw resistance at the VAH before moving lower. Traders who went short from the VAH were likely to be encouraged by the move below the VAL, adding momentum to the move.
Keep in mind, prices can also quickly reverse outside of the value area because of low liquidity and market participants who are taking profits or cutting losses.
Trading p- and b-shaped volume profiles
The volume profile often carves out shapes in the form of a p or b on the chart. Traders can use these shapes to inform their trading decisions.
A p-shaped pattern often occurs when prices have risen and then entered a period of consolidation. Alternatively, a b-shaped pattern occurs when prices have sold off and then consolidated.
These patterns are best viewed when setting the time per profile on the indicator to a longer timeframe, such as a chart that contains multiple months’ worth of price data.
p-shaped volume profile
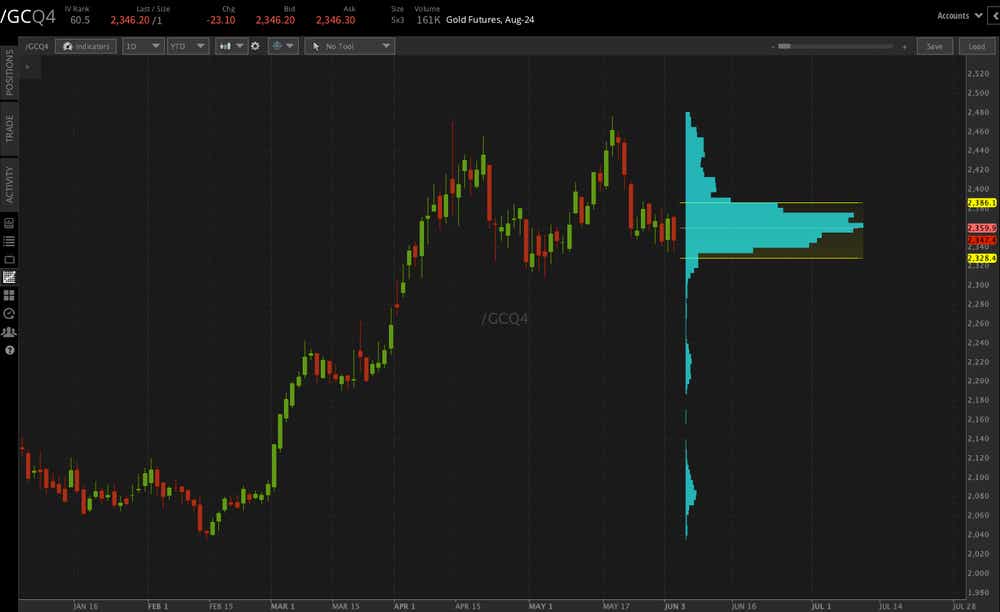
The below chart shows the gold futures contract (/GC) on a daily timeframe going back to Jan. 1. The volume profile represents a p pattern, with most of the volume contained near the top of the range following the uptrend.
During the rally in gold, we see that there wasn’t much volume traded compared to the period from April to June when prices consolidated. The result is a p-pattern in the volume profile.
Traders can see this as a bullish sign because prices have maintained their gains despite a high number of shares trading hands. Longs have likely taken their profits while new trades are coming into the asset. The fact that prices haven’t given up their gains suggests traders are building a position in anticipation of a continuation higher.
b-shaped volume profile
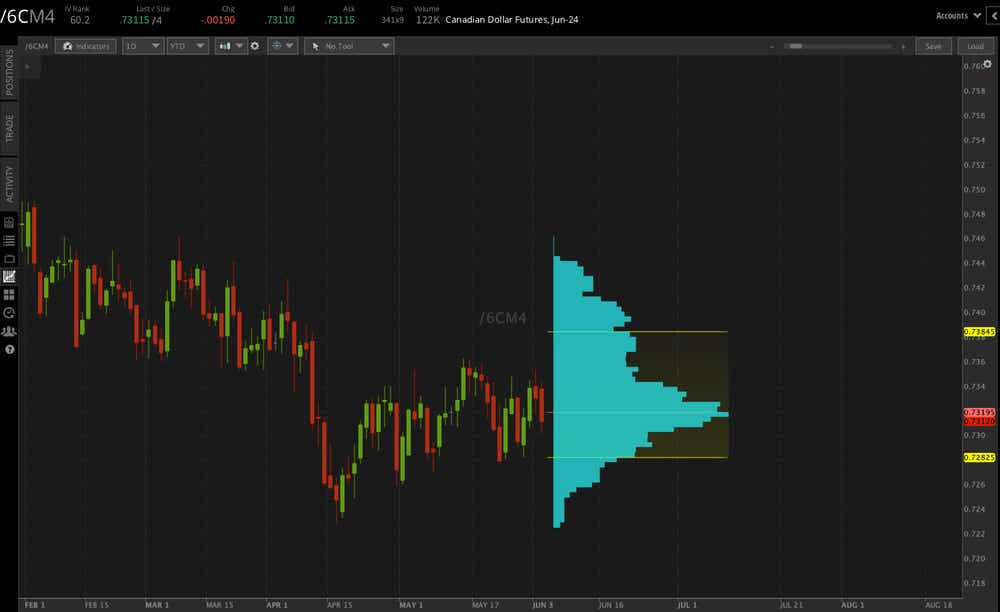
Here we see a daily chart of the Canadian dollar futures contract (/6C) going back to February. The volume profile here shows a b pattern, with most of the volume traded at the bottom of the range.
During the Canadian dollar’s decline from February to April, there wasn’t much volume compared to the consolidative range from May to June, which carved out the b pattern.
The fact that consolidation has occurred near the bottom of the range without a substantial trend reversal suggests traders are entering with the view that the previous downtrend will continue.
Thomas Westwater, a tastylive financial writer and analyst, has eight years of markets and trading experience. @fxwestwater
For live daily programming, market news and commentary, visit tastylive or the YouTube channels tastylive (for options traders), and tastyliveTrending for stocks, futures, forex & macro.
Trade with a better broker, open a tastytrade account today. tastylive, Inc. and tastytrade, Inc. are separate but affiliated companies.
Options involve risk and are not suitable for all investors. Please read Characteristics and Risks of Standardized Options before deciding to invest in options.
tastylive content is created, produced, and provided solely by tastylive, Inc. (“tastylive”) and is for informational and educational purposes only. It is not, nor is it intended to be, trading or investment advice or a recommendation that any security, futures contract, digital asset, other product, transaction, or investment strategy is suitable for any person. Trading securities, futures products, and digital assets involve risk and may result in a loss greater than the original amount invested. tastylive, through its content, financial programming or otherwise, does not provide investment or financial advice or make investment recommendations. Investment information provided may not be appropriate for all investors and is provided without respect to individual investor financial sophistication, financial situation, investing time horizon or risk tolerance. tastylive is not in the business of transacting securities trades, nor does it direct client commodity accounts or give commodity trading advice tailored to any particular client’s situation or investment objectives. Supporting documentation for any claims (including claims made on behalf of options programs), comparisons, statistics, or other technical data, if applicable, will be supplied upon request. tastylive is not a licensed financial adviser, registered investment adviser, or a registered broker-dealer. Options, futures, and futures options are not suitable for all investors. Prior to trading securities, options, futures, or futures options, please read the applicable risk disclosures, including, but not limited to, the Characteristics and Risks of Standardized Options Disclosure and the Futures and Exchange-Traded Options Risk Disclosure found on tastytrade.com/disclosures.
tastytrade, Inc. ("tastytrade”) is a registered broker-dealer and member of FINRA, NFA, and SIPC. tastytrade was previously known as tastyworks, Inc. (“tastyworks”). tastytrade offers self-directed brokerage accounts to its customers. tastytrade does not give financial or trading advice, nor does it make investment recommendations. You alone are responsible for making your investment and trading decisions and for evaluating the merits and risks associated with the use of tastytrade’s systems, services or products. tastytrade is a wholly-owned subsidiary of tastylive, Inc.
tastytrade has entered into a Marketing Agreement with tastylive (“Marketing Agent”) whereby tastytrade pays compensation to Marketing Agent to recommend tastytrade’s brokerage services. The existence of this Marketing Agreement should not be deemed as an endorsement or recommendation of Marketing Agent by tastytrade. tastytrade and Marketing Agent are separate entities with their own products and services. tastylive is the parent company of tastytrade.
tastyfx, LLC (“tastyfx”) is a Commodity Futures Trading Commission (“CFTC”) registered Retail Foreign Exchange Dealer (RFED) and Introducing Broker (IB) and Forex Dealer Member (FDM) of the National Futures Association (“NFA”) (NFA ID 0509630). Leveraged trading in foreign currency or off-exchange products on margin carries significant risk and may not be suitable for all investors. We advise you to carefully consider whether trading is appropriate for you based on your personal circumstances as you may lose more than you invest.
tastycrypto is provided solely by tasty Software Solutions, LLC. tasty Software Solutions, LLC is a separate but affiliate company of tastylive, Inc. Neither tastylive nor any of its affiliates are responsible for the products or services provided by tasty Software Solutions, LLC. Cryptocurrency trading is not suitable for all investors due to the number of risks involved. The value of any cryptocurrency, including digital assets pegged to fiat currency, commodities, or any other asset, may go to zero.
© copyright 2013 - 2026 tastylive, Inc. All Rights Reserved. Applicable portions of the Terms of Use on tastylive.com apply. Reproduction, adaptation, distribution, public display, exhibition for profit, or storage in any electronic storage media in whole or in part is prohibited under penalty of law, provided that you may download tastylive’s podcasts as necessary to view for personal use. tastylive was previously known as tastytrade, Inc. tastylive is a trademark/servicemark owned by tastylive, Inc.
Your privacy choices