Stock Market Outlook 2023 for the Worst Performing S&P 500 Sectors

Stock Market Outlook 2023 for the Worst Performing S&P 500 Sectors
2023 Outlook for Underperforming Sectors
While it’s fair to say 2022 is a rough year for the equity markets, a couple sectors and individual stocks will make it through the year relatively unscathed. While other sectors that consistently outperformed in previous years are deepest in the sea of red as we head into 2023.
The SPDR S&P 500 exchange traded fund (ETF), SPY, is facing its worst year since the financial crisis of 2008, which saw a drop of nearly 37%. Contextually, SPY’s 17.4% drop this year sounds far less drastic. A deeper dive shows where the losses are concentrated within the index, specifically with four sectors down more than 20% each.
Below is a look at the worst performing sectors of the year and their outlook for the next 12 months.
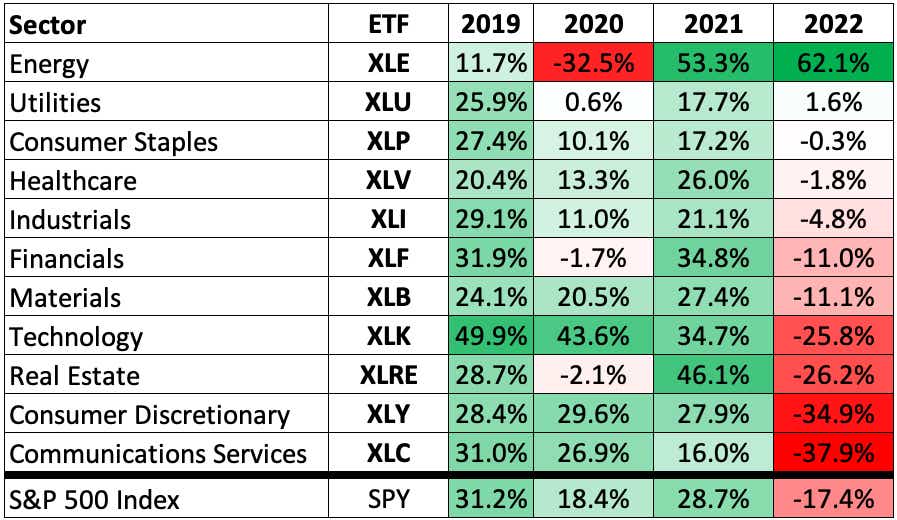
4 Worst Stock Market Sectors of 2022*
1. Technology (XLK)
| Technology (XLK) Top 5 Holdings | |||
| Company | Symbol | % of ETF | 2022 Return |
| Apple Inc | AAPL | 21.5% | -27.7% |
| Microsoft Corp | MSFT | 20.4% | -29.5% |
| NVIDIA Corp | NVDA | 5.0% | -48.9% |
| VISA Inc | V | 4.0% | -7.7% |
| Paypal | PYPL | 3.4% | -65.5% |
After being a dominant force for multiple years, the technology sector now faces a 25% loss as 2022 ends. XLK, the SPDR Technology Sector ETF, contains the two largest components of the overall index, with Apple (AAPL) and Microsoft (MSFT) comprising over 41% of the ETF. XLK itself represents over 25% of the S&P 500, thanks the holdings in AAPL and MSFT. The losses in these two stocks represent a sizeable amount of the negative performance for the overall index.
Any rebound in the technology sector for 2023 will largely be driven by the performance of AAPL and MSFT. It seems like ancient history when AAPL hit its all-time high of $182.94, but that occurred on the second trading day of this year, January 4th.
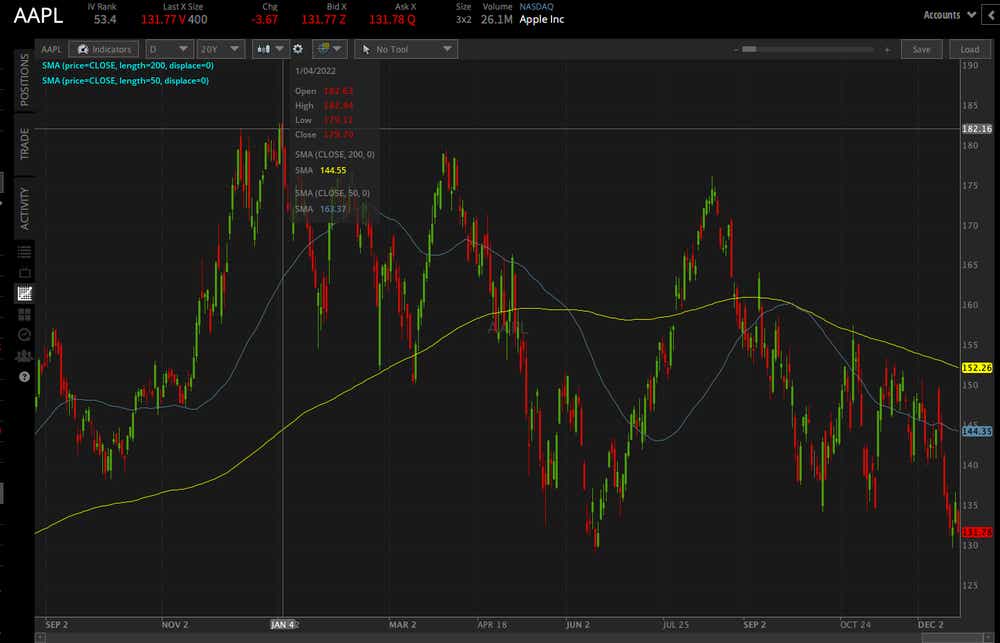
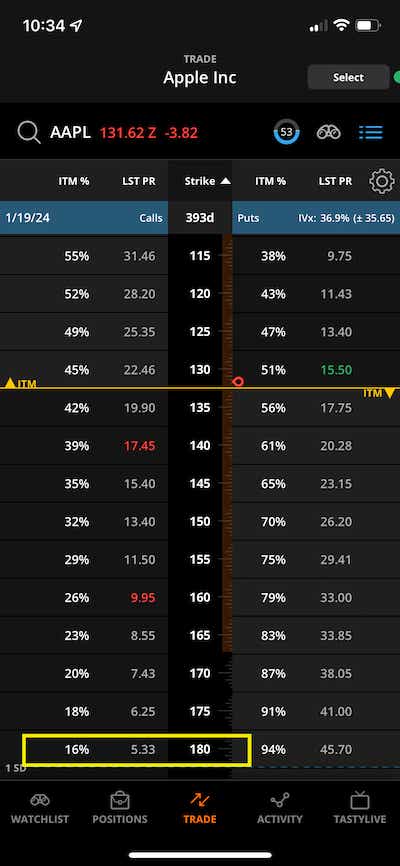
Though analysts remain optimistic AAPL will find that price level again, current averages for bullish analyst sentiment point to the stock rebounding above $180 in the future. Pricing for Call options for AAPL indicate around a 16% chance of AAPL being above $180 by the end of 2023, using the January 2024 options and % In-the-money (ITM) metric on the tastytrade mobile app.
MSFT reached its all-time high of $349.67 in November of 2021. With the stock currently trading near $235, analysts are less optimistic MSFT will find the $350 any time soon, though Wall Street analysts do see a rebound possible for the tech-giant with a current bullish price target average above $300. The options indicate a roughly 20% chance of MSFT being above $300 by the end of 2023.
While the overall technology sector will largely move with the movements in AAPL and MSFT, there remains another 60% of XLK’s portfolio allocated across 74 other equities. XLK opened the year at $174.10, not far off its $177.04 all-time high, and while the ETF saw some strong rallies throughout the year, the were both preceded and followed by sharp selloffs. The probability of XLK seeing a 20% rally by the end of 2023 is approximately 25% according to the options markets. However, the chance of XLK reaching new highs in the coming year is below 9%.
2. Real Estate (XLRE)
| Real Estate (XLRE) Top 5 Holdings | |||
| Company | Symbol | % of ETF | 2022 Return |
| American Tower Corp | AMT | 13.1% | -27.7% |
| Prologis Inc | PLD | 9.4% | -32.5% |
| Crown Castle International Corp | CCI | 8.9% | -35.7% |
| Equinix Inc | EQIX | 7.7% | -22.9% |
| Public Storage | PSA | 4.9% | -23.7% |
The SPDR Real Estate Sector ETF (XLRE) is a portfolio of the real estate investment trusts (REITs) that are a part of the S&P 500 index. XLRE is the 3rd worse performing sector ETF, having lost over 26% by December 21st. XLRE’s price ended up fairly flat for the year of 2020 after rebounding off of the lows of the initial pandemic drop. However, last year XLRE posted a 46% return, second only to the energy sector in 2021.
Representing over 13% of the portfolio, American Tower Corp (AMT) is the largest holding in XLRE. AMT operates wireless cell towers and other infrastructure. Over 10 years the REIT returned nearly 300% to investors at its peak last year. Trading at $207, AMT is now far below that $303 high. Average bullish ratings indicate analysts expect AMT back above $250 in the future.
The likelihood of the real estate sector and XLRE making a full recovery in the coming year are pretty low. The long-dated options indicate only a 5% chance of XLRE being above its prior high by the end of 2023.
3. Consumer Discretionary (XLY)
| Consumer Discretionary (XLY) Top 5 Holdings | |||
| Company | Symbol | % of ETF | 2022 Return |
| Amazon.com Inc | AMZN | 23.5% | -52% |
| Tesla Inc | TSLA | 11.5% | -69% |
| Home Depot Inc | HD | 10.2% | -24% |
| NIKE Inc | NKE | 4.7% | -30% |
| McDonalds Corporation | MCD | 4.7% | -2% |
With constant discussions of recession, and the continued battle with inflation, it’s no surprise that the consumer discretionary sector is struggling this year. The SPDR Consumer Discretionary ETF (XLY) is now down nearly 35% for the year, with its two largest holdings paving the way lower. Amazon (AMZN) has lost over 50% of its value since January, with shares of Tesla (TSLA) down almost 70% for the year.
Compared to many other large names, AMZN found its all-time high early in 2021, hitting $188.65 in July of last year. AMZN’s selloff, that continued into this year started earlier than the overall indices, beginning to fall in November 2021. Shares are now more than $100 below that level at a sub-$83 price. Wall Street remains bullish on AMZN, with buy-side analysts being the outspoken majority. An average of bullish price-targets looks for shares to rebound above the $150 level. The derivatives markets look less optimistic, with June options indicating a $150 price at less than 3% probability and a roughly 6% probability by the end of 2023.
TSLA continues to dominate financial headlines as its falling price hurts index, sector, and stockholders alike. After strong rallies in 2020 and 2021, TSLA has now retraced to levels last seen in September 2020. At $124 per share, the $414.50 highs of 2021 seem like a fantasy. Analysts seem to agree, and while there is sentiment out there that TSLA is now oversold, average analyst buy ratings have an aggregate target of around $250, still 40% below the high. However, TSLA’s volatile options market indicates a slim chance of $250 at the end of 2023, with the Jan 2024 options giving the outcome less than a 10% probability. And two years from now, by the end of 2024, the market is pricing less than a 5% chance of the stock retesting its 2021 highs.
Any recovery in AMZN and TSLA is likely to take a long time. This is reflected in the call options for XLY, which indicate the probability of XLY recovering to its previous highs as less than 3% by January 2024.
4. Communication Services (XLC)
| Communication Services (XLC) Top 5 Holdings | |||
| Company | Symbol | % of ETF | 2022 Return |
| Meta Platforms Inc | META | 15.7% | -65.6% |
| Alphabet Inc (Class A) | GOOGL | 12.1% | -39.9% |
| Alphabet Inc (Class C) | GOOG | 10.8% | -39.5% |
| Walt Disney Company | DIS | 9.2% | -45.3% |
| T-Mobile | TMUS | 4.9% | 21.6% |
The worst performing sector for 2022 is communication services. Looking at the holdings of XLC, the SPDR Communication Services ETF, this quickly becomes no surprise. The top three holdings are Meta Platforms (META), formerly Facebook, and the two share classes of Alphabet (GOOG & GOOGL), the parent company of Google. While most investors may think of these firms as tech-giants, their classification and inclusion in the communication services sector. Like the overall market, XLC saw strong returns over the past three years before 2022.
META’s collapse this year was largely publicized as both public and investor sentiment towards Facebook and META’s other businesses turned sharply negative. It’s fair to say that in the market euphoria perhaps META’s shares were never “worth” $384.33, but that’s the price at which the stock topped in August of last year. The options market indicates the chance of META ending 2023 above $385 is less than 1%. Industry analysts do see opportunity for META here, with a plethora of bullish ratings averaging $157 as a price target.
While GOOG and GOOGL are the second and third holdings of XLY, their combined weighting means Alphabet represents nearly 23% of the ETF and nearly 3.4% of the overall S&P 500. Alphabet, like many tech and tech adjacent stocks has a long way to recover If investors are going to see new highs. This looks unlikely for GOOGL in the next two years with projections for the option market putting the $150 price level at a 12% probability. Analysts remain optimistic however, with average buy ratings at $130.
The any recovery of XLC will be dominated by any upward momentum from META, GOOGL, and GOOG. Though in the damage seems to have been done for the foreseeable future. XLC’s high of $86.36 will likely not be seen any time soon, with the 2-year LEAP call options predicting only a 5% chance the ETF ends 2024 above 80.
*All data is current as of Dec 22nd, 2022.
Options involve risk and are not suitable for all investors. Please read Characteristics and Risks of Standardized Options before deciding to invest in options.
tastylive content is created, produced, and provided solely by tastylive, Inc. (“tastylive”) and is for informational and educational purposes only. It is not, nor is it intended to be, trading or investment advice or a recommendation that any security, futures contract, digital asset, other product, transaction, or investment strategy is suitable for any person. Trading securities, futures products, and digital assets involve risk and may result in a loss greater than the original amount invested. tastylive, through its content, financial programming or otherwise, does not provide investment or financial advice or make investment recommendations. Investment information provided may not be appropriate for all investors and is provided without respect to individual investor financial sophistication, financial situation, investing time horizon or risk tolerance. tastylive is not in the business of transacting securities trades, nor does it direct client commodity accounts or give commodity trading advice tailored to any particular client’s situation or investment objectives. Supporting documentation for any claims (including claims made on behalf of options programs), comparisons, statistics, or other technical data, if applicable, will be supplied upon request. tastylive is not a licensed financial adviser, registered investment adviser, or a registered broker-dealer. Options, futures, and futures options are not suitable for all investors. Prior to trading securities, options, futures, or futures options, please read the applicable risk disclosures, including, but not limited to, the Characteristics and Risks of Standardized Options Disclosure and the Futures and Exchange-Traded Options Risk Disclosure found on tastytrade.com/disclosures.
tastytrade, Inc. ("tastytrade”) is a registered broker-dealer and member of FINRA, NFA, and SIPC. tastytrade was previously known as tastyworks, Inc. (“tastyworks”). tastytrade offers self-directed brokerage accounts to its customers. tastytrade does not give financial or trading advice, nor does it make investment recommendations. You alone are responsible for making your investment and trading decisions and for evaluating the merits and risks associated with the use of tastytrade’s systems, services or products. tastytrade is a wholly-owned subsidiary of tastylive, Inc.
tastytrade has entered into a Marketing Agreement with tastylive (“Marketing Agent”) whereby tastytrade pays compensation to Marketing Agent to recommend tastytrade’s brokerage services. The existence of this Marketing Agreement should not be deemed as an endorsement or recommendation of Marketing Agent by tastytrade. tastytrade and Marketing Agent are separate entities with their own products and services. tastylive is the parent company of tastytrade.
tastyfx, LLC (“tastyfx”) is a Commodity Futures Trading Commission (“CFTC”) registered Retail Foreign Exchange Dealer (RFED) and Introducing Broker (IB) and Forex Dealer Member (FDM) of the National Futures Association (“NFA”) (NFA ID 0509630). Leveraged trading in foreign currency or off-exchange products on margin carries significant risk and may not be suitable for all investors. We advise you to carefully consider whether trading is appropriate for you based on your personal circumstances as you may lose more than you invest.
tastycrypto is provided solely by tasty Software Solutions, LLC. tasty Software Solutions, LLC is a separate but affiliate company of tastylive, Inc. Neither tastylive nor any of its affiliates are responsible for the products or services provided by tasty Software Solutions, LLC. Cryptocurrency trading is not suitable for all investors due to the number of risks involved. The value of any cryptocurrency, including digital assets pegged to fiat currency, commodities, or any other asset, may go to zero.
© copyright 2013 - 2026 tastylive, Inc. All Rights Reserved. Applicable portions of the Terms of Use on tastylive.com apply. Reproduction, adaptation, distribution, public display, exhibition for profit, or storage in any electronic storage media in whole or in part is prohibited under penalty of law, provided that you may download tastylive’s podcasts as necessary to view for personal use. tastylive was previously known as tastytrade, Inc. tastylive is a trademark/servicemark owned by tastylive, Inc.
Your privacy choices