S&P 500 and Nasdaq 100 Surge into Resistance Ahead of FOMC Meeting

S&P 500 and Nasdaq 100 Surge into Resistance Ahead of FOMC Meeting
But Sept. 17 to 30 is the worst part of the trading year, and it begins tomorrow
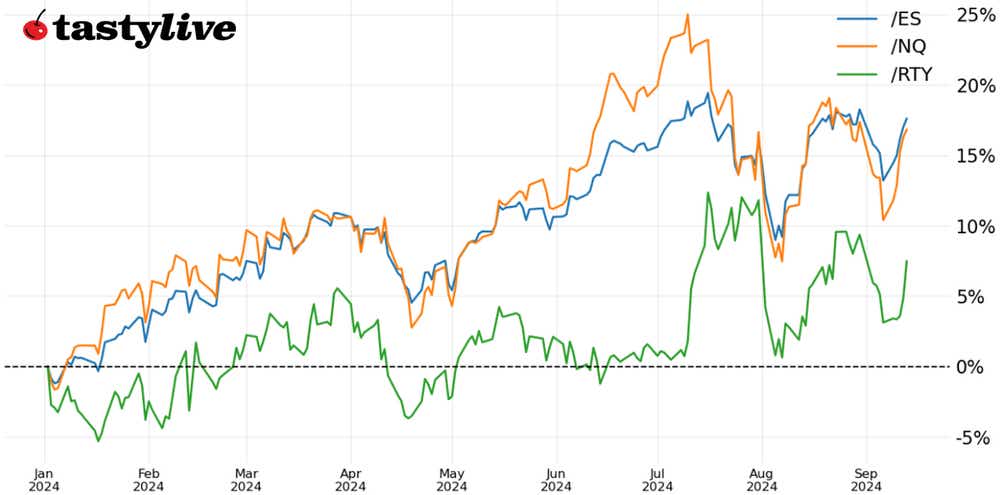
September seasonality may be terrible, but this week was fantastic: The Nasdaq 100 (/NQU4) had its best week of the year, while the S&P 500 (/ESU4) and Russell 2000 (/RTYU4) clocked their second best weeks of 2042.
Each of /ESU4, /NQU4, and /RTYU4 are nearing resistance in symmetrical triangles, suggesting breakouts from multi-month consolidations may loom.
The September seasonality gets more severe moving forward, however: Sept. 17 to 30 is the worst part of the worst month of the year.
Market Update: S&P 500 down 0.56% month-to-date
September has brought the usual promise of elevated volatility and rollercoasters for U.S. equity markets. Two-way action has been acute: the S&P 500 (/ESU4) was down 4.86% for the month at one point, only to rally back to a more modest loss of 0.56% in September thus far.
The turnaround last week was dramatic. Not only did the S&P 500 register its second-best week of the year, so too did the Russell 2000 (/RTYU4). They were both bested by the Nasdaq 100 (/NQU4), whose performance last week takes the pole position on the leaderboard for best weekly performance of 2024.
Technical structures in place at the end of August, which appeared to be increasingly bullish, have been stress-tested over the past two weeks. By and large, equity indexes have survived those tests. Yet we’re not out of the woods just yet. Keeping September’s shocking seasonality in mind, it’s worth noting the worst part of the worst month of the year is just around the corner, starting tomorrow and continuing to Sept. 30. During this window, the Federal Open Market Committee (FOMC) will meet, and its possible the federal government will shut down.
Bullish breakouts may indeed be around the corner, as symmetrical triangles typically have bullish resolutions. But as was noted heading into September, “it stands to reason that traders may look upon the improved technical structures and decimation in volatility with skepticism” and instead use the opportunity to reduce the beta-weighted delta of their portfolios, either by taking profit on short volatility/long equity positions or buying cheaper out-of-the-money (OTM) puts as protection for what the second half of September may bring.
/ES S&P 500 Price Technical Analysis: Daily Chart (October 2023 to September 2024)
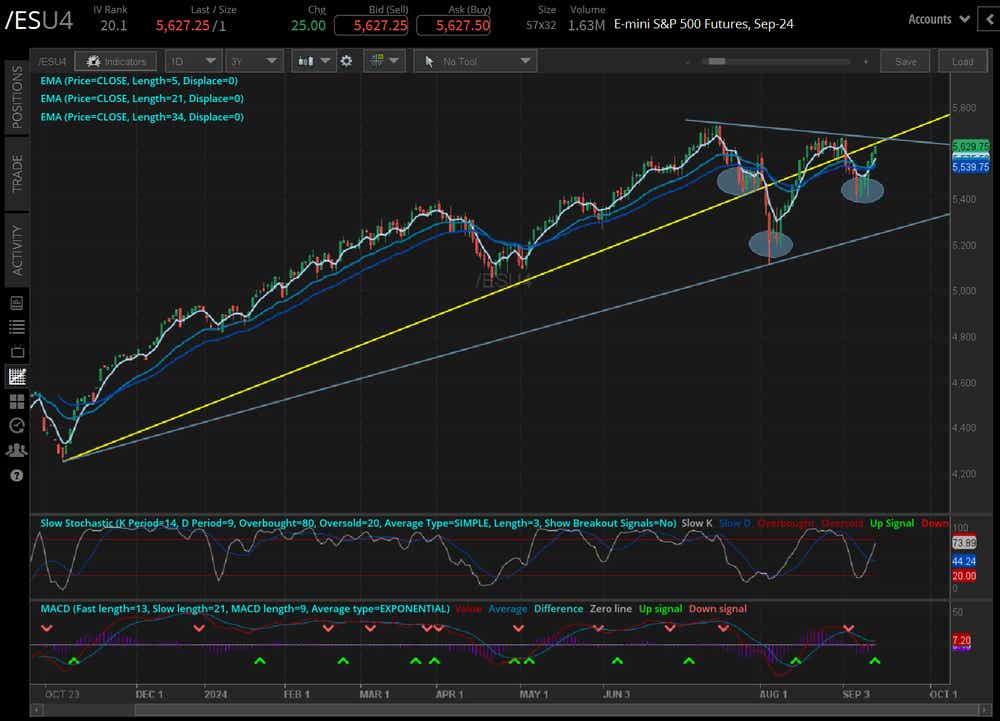
While the S&P 500 (/ESU4) may not be far removed from where it was at the start of September, the technical structure has evolved. At the start of the month, /ESU4 was trading above the trendline from the October 2023 and July 2024 lows; midway through the month, it is now below it. Likewise, the descending trendline from the July and August swing highs has yet to be breached, nor have the late-August highs; there is meaningful technical resistance immediately overhead.
The momentum profile has improved, nevertheless. /ESU4 is trading above its daily five-EMA (exponential moving average), daily 21-EMA and daily 34-EMA: T he EMAs are in bullish sequential order. Slow stochastics are trending higher through their median line, and MACD is trending higher through its signal line, having just issued a buy signal. Volatility has contracted (IVR: 20.1) after the early-month jump, but the VIX remains above 15.
From a technical standpoint, if /ESU4 were to break above 5670, it would appear that an inverse head and shoulders pattern, or a symmetrical triangle, breakout would be in the cards. The measured move higher, depending upon measurement points, would call for /ESU4 to trade above 6100, and perhaps as high as 6300, into the end of the year. If the breakout were to transpire alongside a drop in the VIX below 15, it would be suitable to express bullishness through ATM (at-the-money) calls (or call spreads).
Failure to scale above 5670 would mean that consolidation remains, and a return to FOMC meeting on Wednesday, given the contraction in volatility, one way to express the view that /ESU4 won’t break out this week but will ultimately trade higher is to deploy a short put calendar around the Sept. 30 and Oct. 31 expiries.
/NQ Nasdaq 100 Price Technical Analysis: Daily Chart (October 2023 to September 2024)
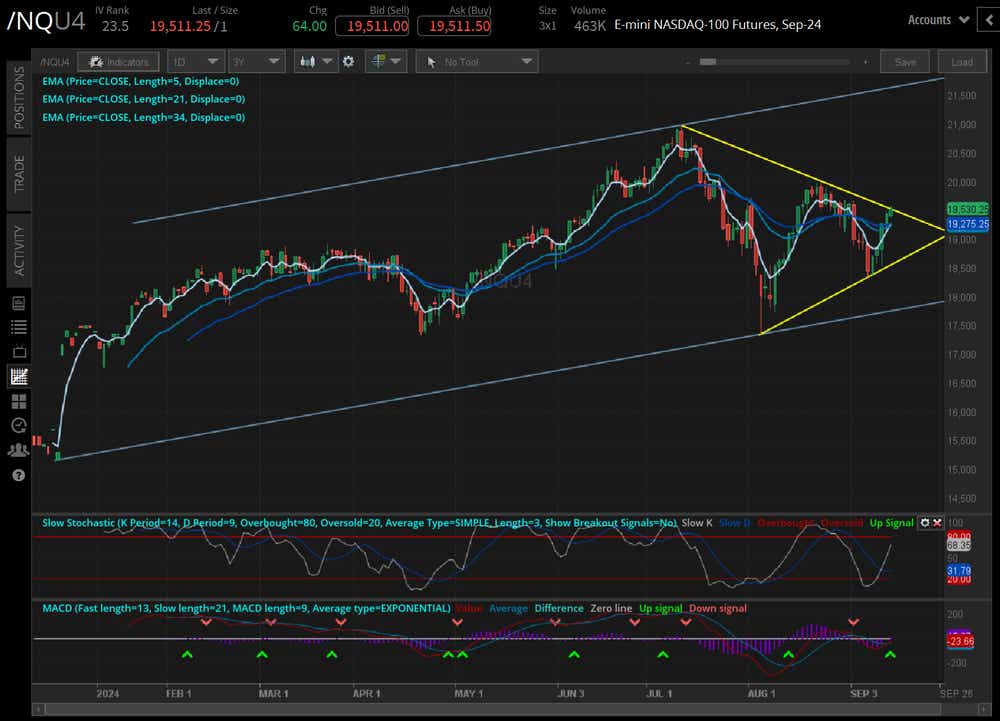
The technical outlook for the Nasdaq 100 (/NQU4) is remarkably similar to that of /ESU4: the momentum profile is effectively identical, and a symmetrical appears to have been forming in recent months. The strategic approach thus remains the same with respect to trading ATM calls (or call spreads) in the event of a bullish breakout, as well as it does for potentially preparing for a weaker market around the Fed with short put calendars. In clearing the Sept. 3 high, /NQU4 would break the bearish engulfing bar that marked the monthly high and set up a return to the Aug. 22 bearish key reversal candlestick high at 20025.25.
/RTY Russell 2000 Price Technical Analysis: Daily Chart (March 2023 to September 2024)
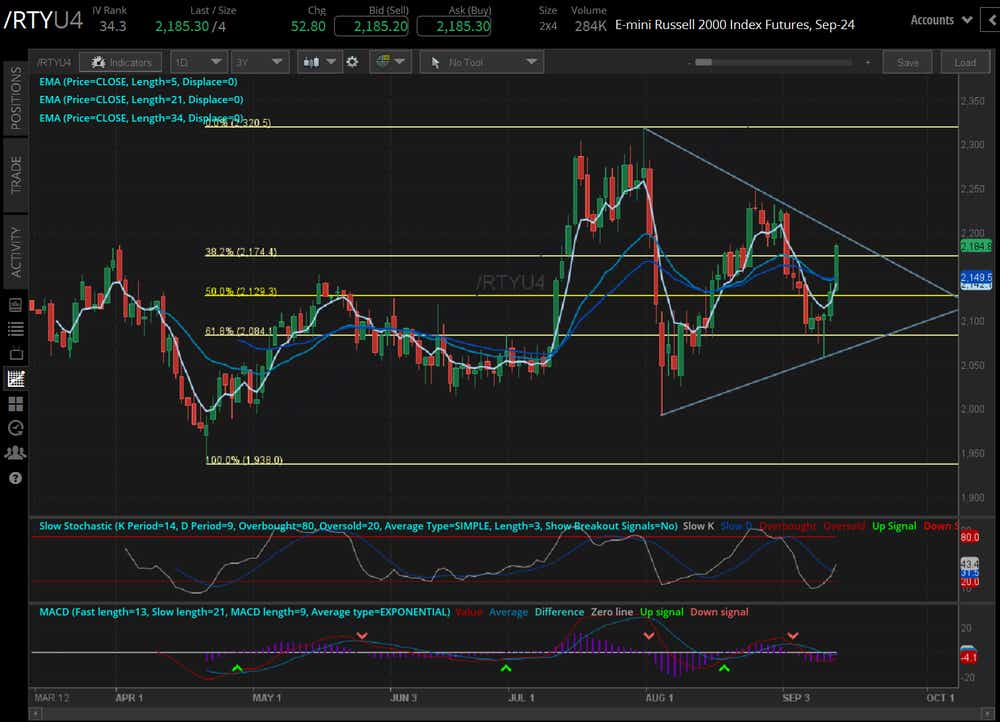
Do you like broken records? If so, the Russell 2000 (/RTYU4) outlook may sound familiar: /RTYU4 is in a symmetrical like /ESU4 and /NQU4, and it is trading up to triangle resistance. The weekly close in /RTYU4 above the 38.2% Fibonacci retracement of the April low/July high trading range alongside a drop in volatility (IVR: 34.3) makes iron condors wrapped around the six-month trading range less appealing. Similarly, it’s not appealing to trade bullish breakout conditions yet because the consolidation remains. That said, if /RTYU4 does break out, it may be ready to go through a period of catchup to its mega cap brethren. The Fed rate hike cycle may have hurt smaller companies more than bigger companies, but it would stand to reason it may help smaller companies moving forward.
Christopher Vecchio, CFA, tastylive’s head of futures and forex, has been trading for nearly 20 years. He has consulted with multinational firms on FX hedging and lectured at Duke Law School on FX derivatives. Vecchio searches for high-convexity opportunities at the crossroads of macroeconomics and global politics. He hosts Futures Power Hour Monday-Friday and Let Me Explain on Tuesdays, and co-hosts Overtime, Monday-Thursday. @cvecchiofx
For live daily programming, market news and commentary, visit tastylive or the YouTube channels tastylive (for options traders), and tastyliveTrending for stocks, futures, forex & macro.
Trade with a better broker, open a tastytrade account today. tastylive, Inc. and tastytrade, Inc. are separate but affiliated companies.
Options involve risk and are not suitable for all investors. Please read Characteristics and Risks of Standardized Options before deciding to invest in options.
tastylive content is created, produced, and provided solely by tastylive, Inc. (“tastylive”) and is for informational and educational purposes only. It is not, nor is it intended to be, trading or investment advice or a recommendation that any security, futures contract, digital asset, other product, transaction, or investment strategy is suitable for any person. Trading securities, futures products, and digital assets involve risk and may result in a loss greater than the original amount invested. tastylive, through its content, financial programming or otherwise, does not provide investment or financial advice or make investment recommendations. Investment information provided may not be appropriate for all investors and is provided without respect to individual investor financial sophistication, financial situation, investing time horizon or risk tolerance. tastylive is not in the business of transacting securities trades, nor does it direct client commodity accounts or give commodity trading advice tailored to any particular client’s situation or investment objectives. Supporting documentation for any claims (including claims made on behalf of options programs), comparisons, statistics, or other technical data, if applicable, will be supplied upon request. tastylive is not a licensed financial adviser, registered investment adviser, or a registered broker-dealer. Options, futures, and futures options are not suitable for all investors. Prior to trading securities, options, futures, or futures options, please read the applicable risk disclosures, including, but not limited to, the Characteristics and Risks of Standardized Options Disclosure and the Futures and Exchange-Traded Options Risk Disclosure found on tastytrade.com/disclosures.
tastytrade, Inc. ("tastytrade”) is a registered broker-dealer and member of FINRA, NFA, and SIPC. tastytrade was previously known as tastyworks, Inc. (“tastyworks”). tastytrade offers self-directed brokerage accounts to its customers. tastytrade does not give financial or trading advice, nor does it make investment recommendations. You alone are responsible for making your investment and trading decisions and for evaluating the merits and risks associated with the use of tastytrade’s systems, services or products. tastytrade is a wholly-owned subsidiary of tastylive, Inc.
tastytrade has entered into a Marketing Agreement with tastylive (“Marketing Agent”) whereby tastytrade pays compensation to Marketing Agent to recommend tastytrade’s brokerage services. The existence of this Marketing Agreement should not be deemed as an endorsement or recommendation of Marketing Agent by tastytrade. tastytrade and Marketing Agent are separate entities with their own products and services. tastylive is the parent company of tastytrade.
tastyfx, LLC (“tastyfx”) is a Commodity Futures Trading Commission (“CFTC”) registered Retail Foreign Exchange Dealer (RFED) and Introducing Broker (IB) and Forex Dealer Member (FDM) of the National Futures Association (“NFA”) (NFA ID 0509630). Leveraged trading in foreign currency or off-exchange products on margin carries significant risk and may not be suitable for all investors. We advise you to carefully consider whether trading is appropriate for you based on your personal circumstances as you may lose more than you invest.
tastycrypto is provided solely by tasty Software Solutions, LLC. tasty Software Solutions, LLC is a separate but affiliate company of tastylive, Inc. Neither tastylive nor any of its affiliates are responsible for the products or services provided by tasty Software Solutions, LLC. Cryptocurrency trading is not suitable for all investors due to the number of risks involved. The value of any cryptocurrency, including digital assets pegged to fiat currency, commodities, or any other asset, may go to zero.
© copyright 2013 - 2026 tastylive, Inc. All Rights Reserved. Applicable portions of the Terms of Use on tastylive.com apply. Reproduction, adaptation, distribution, public display, exhibition for profit, or storage in any electronic storage media in whole or in part is prohibited under penalty of law, provided that you may download tastylive’s podcasts as necessary to view for personal use. tastylive was previously known as tastytrade, Inc. tastylive is a trademark/servicemark owned by tastylive, Inc.
Your privacy choices